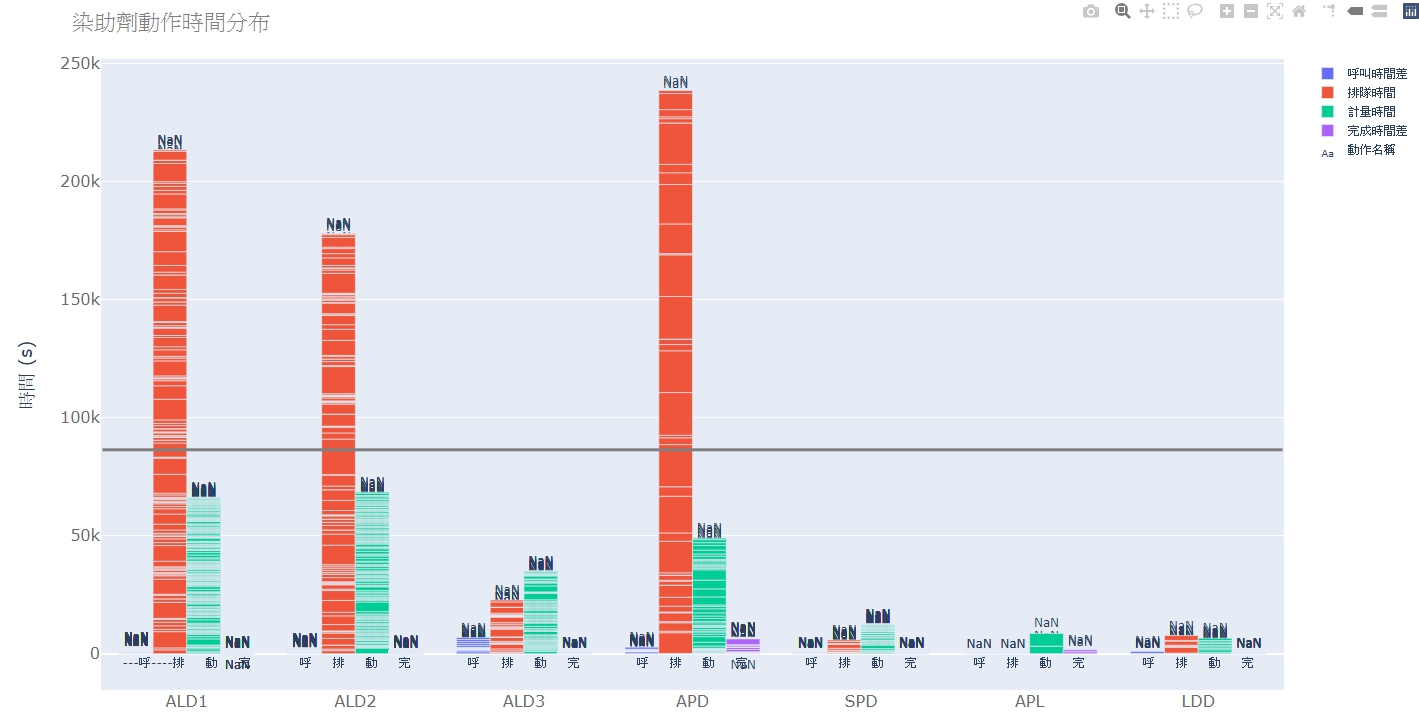
1.How can I display sum properly?
2.I use text to show the group name at the bottom .Is there any way I can use for group name at the bottom display(If it’s possible dynamic with bar zoom in and zoom out)?
code:
import plotly.graph_objs as go
import plotly.offline as py
#分層為stage1
data1= go.Bar(
y=x[‘呼叫時間差’],
x=x[‘機台’], #x軸欄位
name=‘呼叫時間差’)#圖例名稱
#分層為stage2
data2= go.Bar(
y=x[‘排隊時間’],
x=x[‘機台’],
name=‘排隊時間’)
#分層為stage3
data3= go.Bar(
y=x[‘計量時間’],
x=x[‘機台’],
name=‘計量時間’)
#分層為stage4
data4= go.Bar(
y=x[‘完成時間差’],
x=x[‘機台’],
name=‘完成時間差’)
#把各分層結合
data = [data1,data2,data3,data4]
layout = go.Layout(
barmode=‘group’, #設定為堆疊長條圖
title=‘染助劑動作時間分布’, titlefont=dict(family=‘Courier New, monospace’, size=22, color=’#7f7f7f’), #設定標題名稱、字體大小、顏色
xaxis=dict(
    #title='機台', #設定Y軸名稱、字體大小
    titlefont=dict(
        size=16,color='rgb(107, 107, 107)'#設定X軸字體大小、顏色
                  ),
    tickfont=dict(
        size=16, color='rgb(107, 107, 107)'#設定X軸標籤字體大小、顏色
                 ),

         ),

yaxis=dict(
    title='時間 (s)',titlefont=dict(size=18), #設定Y軸名稱、字體大小
    tickfont=dict(
        size=16, color='rgb(107, 107, 107)'#設定Y軸標籤、字體大小、顏色
                 )
         ),margin=go.Margin(l=100,r=60,b=50,t=60,pad=0,) #調整圖表的位子
               )
fig = go.Figure(data=data, layout=layout)
fig.update_layout(xaxis={‘categoryorder’:‘array’, ‘categoryarray’:[‘ALD1’,‘ALD2’,‘ALD3’,‘APD’,‘SPD’,‘APL’,‘LDD’]})# sort by
fig.add_shape(
type=“line”,
xref=“paper”,
yref=“paper”,
x0=-0.5,
y0=86400,
x1=6.5,
y1=86400,
line=dict(
color=“Grey”,
width=3
        ),
    )
fig.update_traces(texttemplate=’%{text:.2s}’, textposition=‘outside’, text=‘pop’)
fig.update_shapes(dict(xref=‘x’, yref=‘y’))
fig.add_trace(go.Scatter(
x=[‘ALD1’,‘ALD2’,‘ALD3’,‘APD’,‘SPD’,‘APL’,‘LDD’],
y=[-2000,-2000,-2000,-2000,-2000,-2000,-2000],
mode=“text”,
name=“動作名稱”,
text=[’—呼----排 動 完’,‘呼 排 動 完’,‘呼 排 動 完’,‘呼 排 動 完’,‘呼 排 動 完’,‘呼 排 動 完’,‘呼 排 動 完’],
textposition=“bottom center”
))
py.plot(fig,filename=‘染助劑動作時間分布-stacked-bar’)