Hi everyone, I’m quite new to Plotly.js (and to JavaScript, for that matter), but I have greatly enjoyed using Plotly.py for Python-based visualizations. I would like to create a standalone HTML file that allows users to select which variable to display (in choropleth form) for a given GeoJSON dataset. (A sample dataset with fictional data that I created for this question is available at this link.)
I could use Plotly.py and Dash for this project; however, I’d like to see whether Plotly.js could be an even better fit, as it should allow me to avoid having to create and host a separate web app.
The tiled Plotly.js choropleth map documentation uses hardcoded values for the ‘z’ field; however, I would like to be able to pass a variable for this field instead (e.g. ‘variable_1’). Is there an easy way to do so within Plotly.js that’s compatible with GeoJSON files?
Another potential hurdle is that my GeoJSON file (which I created within GeoPandas) does not have any “id” field; however, I imagine that I can use the featureidkey parameter to inform Plotly which label (e.g. ‘2020_PUMA_name’) to use instead.
Here’s my HTML/JS code so far. It definitely needs some further work:
<!doctype html>
<!-- Code sources for this example include:
1. https://plotly.com/javascript/tile-county-choropleth/
2. https://plotly.com/javascript/getting-started/
3. https://openfreemap.org/quick_start/
-->

<head>
    <script src="https://cdn.plot.ly/plotly-3.3.0.min.js"></script>
</head>

<body>
    <div>
        <div>
            <label><b>Sample page with fake data for testing out Plotly.js choropleth options</b>
            </label>
        </div>
        <!-- Select tag is based on https://developer.mozilla.org/en-US/docs/Web/HTML/Reference/Elements/select-->
        <!-- This page was also very helpful for linking <select> choices to our iframe's src value via JavaScript:
 https://developer.mozilla.org/en-US/docs/Web/API/HTMLElement/change_event#select_element-->
        <!-- The bootstrap-specific select code shown here was based on the example(s) at
  https://getbootstrap.com/docs/5.3/forms/select/#default .-->
        <div>
            <select class="form-select" id="metric" aria-label="Metric selection">
                <option value="variable_1">Variable 1</option>
                <option value="variable_2">Variable 2</option>
                <option value="variable_3">Variable 3</option>
            </select>
        </div>
    </div>
    </div>

    <div id="sample_map" style="width:90%;height:250px;"></div>


    <script>
        /* The following code is based on
https://developer.mozilla.org/en-US/docs/Learn_web_development/Core/Scripting/Variables */
        // The document.getElementByID line was based on:  https://stackoverflow.com/a/8642538/13097194
        const metric_selectElement = document.getElementById("metric");
        let metric_string = "feature.properties.variable_1"


        metric_selectElement.addEventListener("change", (event) => {
            metric_string = `feature.properties.${event.target.value}`;
            console.log(metric_string);


            SAMPLEMAP = document.getElementById('sample_map');

            // The following code is based on https://plotly.com/javascript/tile-county-choropleth/
            // (With some additions inspired by https://leafletjs.com/examples/choropleth/ )
            var data = [{
                type: "SAMPLEMAP", locations: 'PUMA_name_2020',
                featureidkey:"PUMA_name_2020", z: metric_string,
                geojson: "https://raw.githubusercontent.com/ifstudies/va_pumas_with_fake_data/refs/heads/master/va_puma_level_fictional_data.geojson"
            }];

            var layout = {
                map: {
                    center: { lon: -74, lat: 43 }, zoom: 3.5,
                    style: 'https://tiles.openfreemap.org/styles/bright'
                },
                width: 600, height: 400
            };

            Plotly.newPlot(SAMPLEMAP, data, layout);

        });


    </script>


    </div>
</body>

</html>
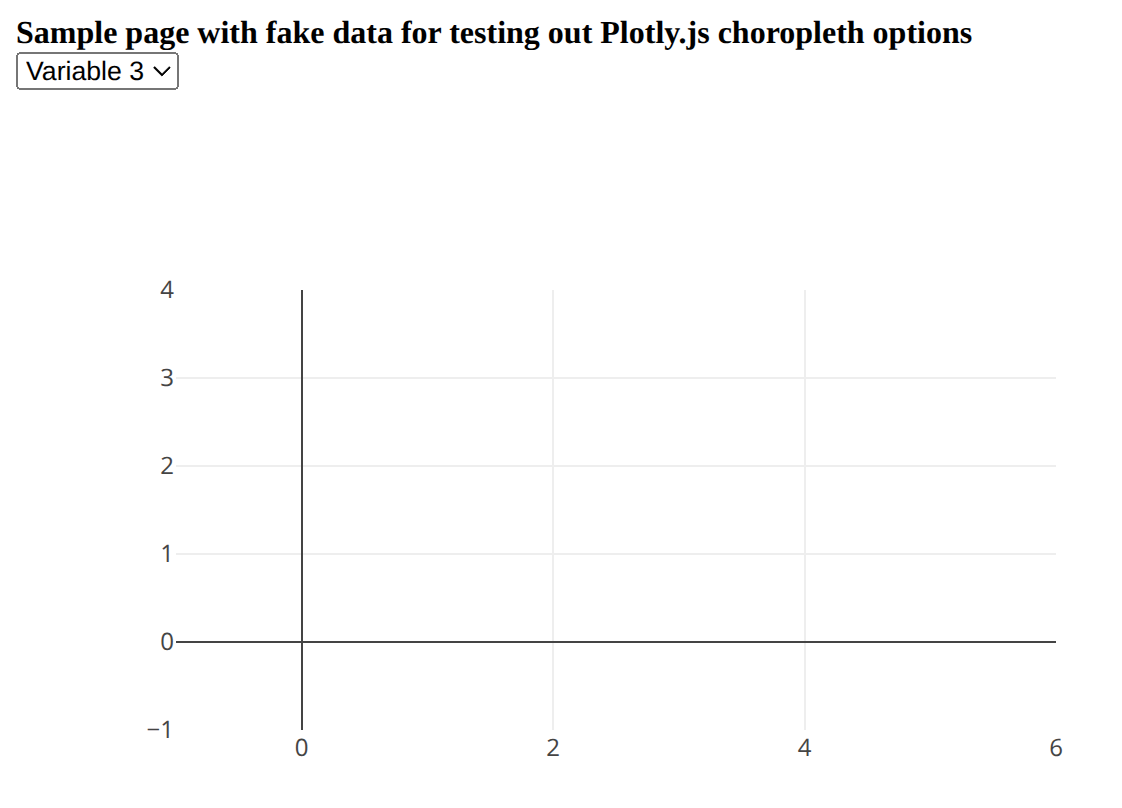
Not surprisingly, my map isn’t displaying or updating correctly with this code:
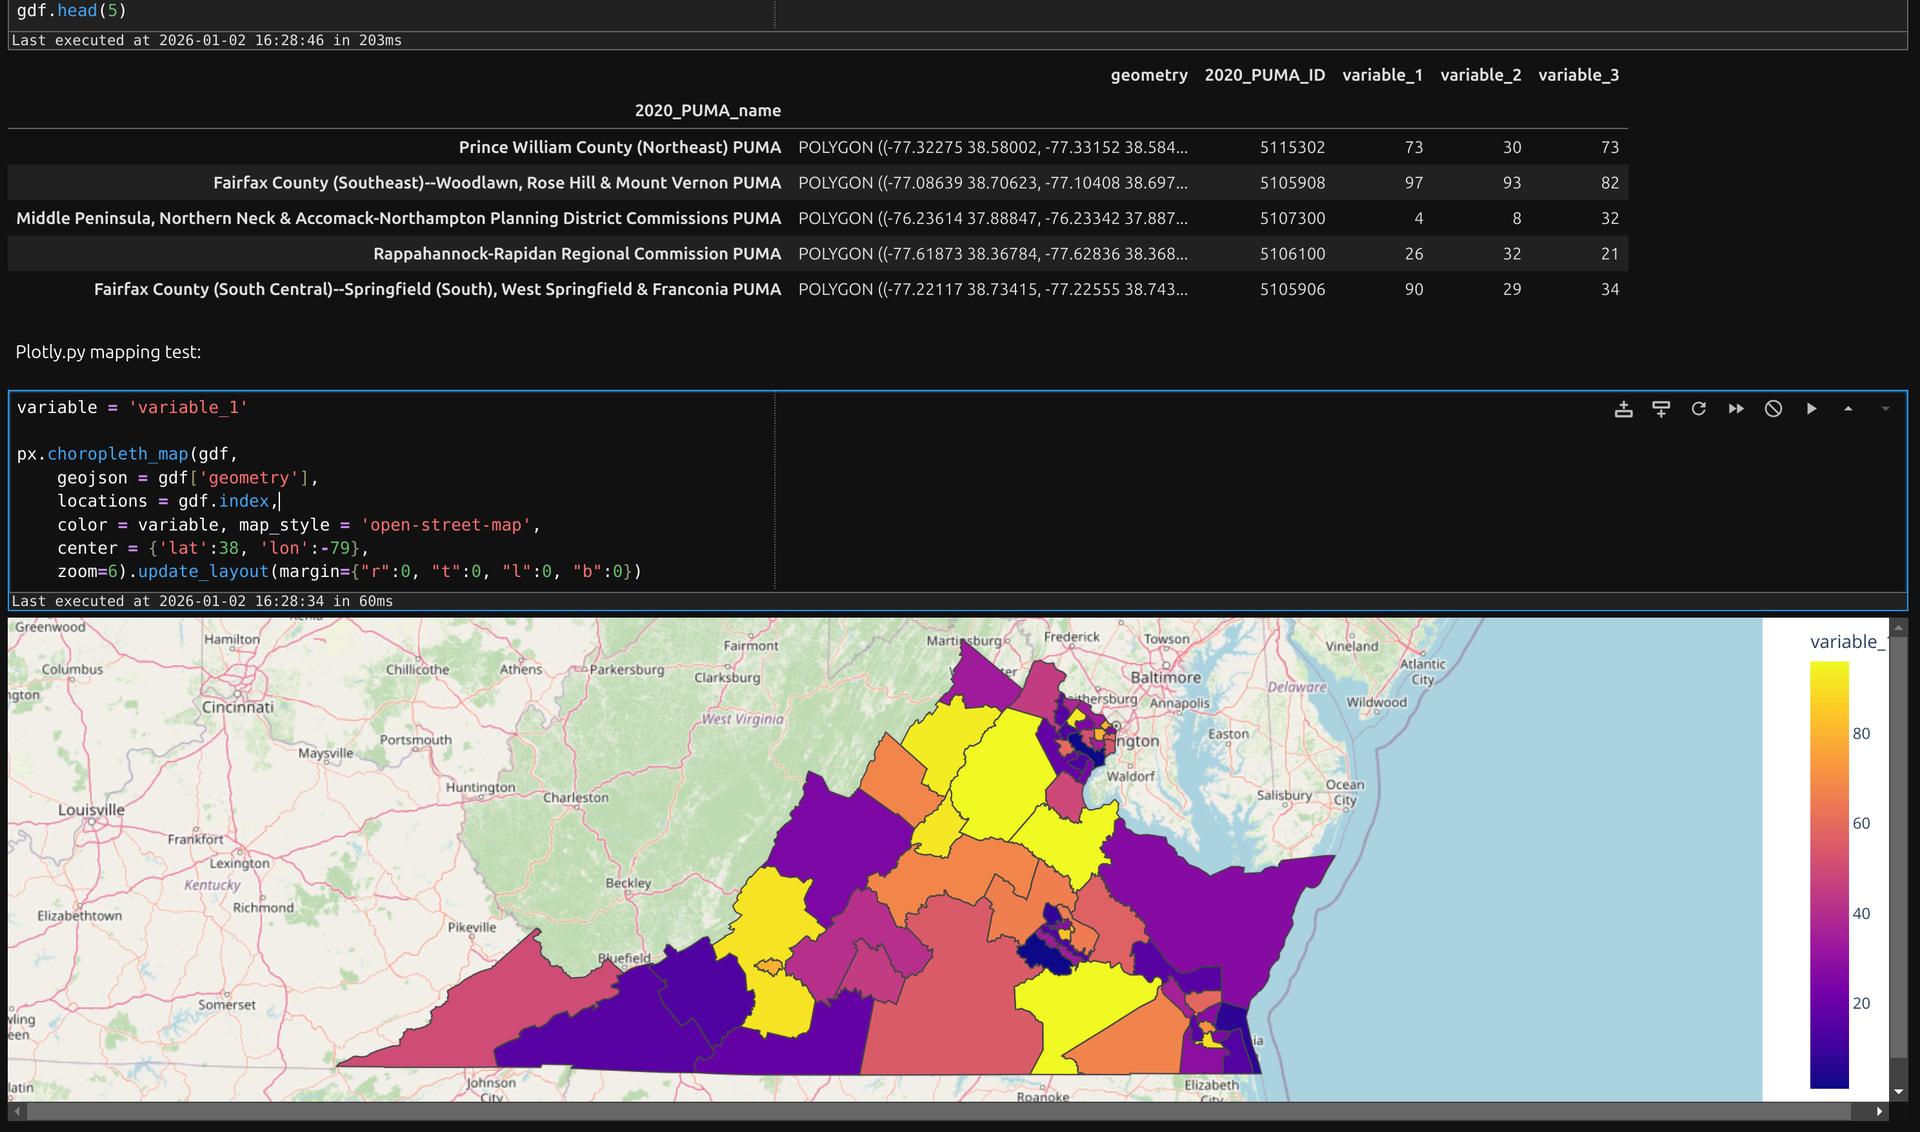
And reference, here’s what a Python-based choropleth map of the ‘variable_1’ field would look like:
Thank you in advance for your help!