stdedos
September 21, 2026, 6:11pm
1
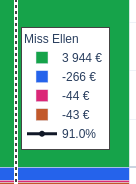
I have a hovermode="x unified" stacked bar graph (with a second y-axis scatter-plot with a connecting line if it makes a difference).
Because the graph renders numbers, I would like to align them all to right for easier reading.
I am trying to set hoverlabel_align="right", as Hover text and formatting in Python shows - but it does not work for me
Bug or feature?
Searched:
Hi @stdedos
Can you provide a minimal example of what you have tried? It seems to work in the docs.
import plotly.graph_objects as go

people = ["Person A", "Person B", "Person C"]

fig = go.Figure()
for name, values in {
    "Series 1": [3944, 2810, 1675],
    "Series 2": [-266, -1020, -85],
    "Series 3": [-44, -310, -7],
    "Series 4": [-43, -5, -390],
}.items():
    fig.add_trace(go.Bar(x=people, y=values, name=name, hovertemplate="%{y:,.0f} €<extra></extra>"))

# --- secondary-axis line: delete this block to test without it ---
fig.add_trace(go.Scatter(
    x=people, y=[0.91, 0.62, 0.785], name="Ratio",
    mode="lines+markers", yaxis="y2", line=dict(color="black"),
    hovertemplate="%{y:.1%}<extra></extra>",
))
fig.update_layout(yaxis2=dict(overlaying="y", side="right", tickformat=".0%"))
# --- end ---

fig.update_layout(
    barmode="relative",
    separators=". ",
    hovermode="x unified",
    hoverlabel=dict(align="right"),
    # Same with
    # hoverlabel_align="right",
)
fig.show()
My expectation is that the €-values would be right-aligned. Those are still left-aligned
Thanks for the example app! This does appear to be a bug in plotly.js. The label is hardcoded to use 'start'. Would you be able to file an issue to get this fixed?
… I guess I can ask AI to copy/paste/fill an issue
Although I’d prefer someone’s expertise in filing the bug / root-cause-analysis better than mine.standardize on attr over style for text-anchor · plotly/plotly.js@3ad11f6 · GitHub ).
I was wondering though - do you have any idea why is my example “different” from the documentation?
This issue is only with unified hover mode. The formatting examples in the docs show only the standard hover - which works fine.
Thanks for filing that! We’ll triage it next week. I think the fix will be pretty small.
This has been fixed in plotly.js and will be released in a future version.