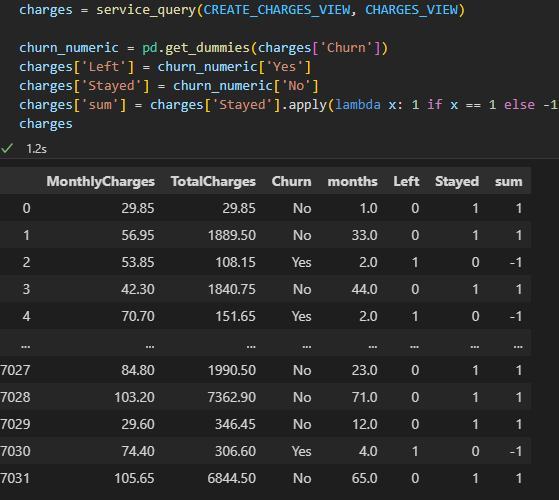
Hello, i have a data set like that

i wanted to make a heatmap, when an X-axis would be months and the Y-axis would be MonthlyCharges, the colour would be the difference between the sum of left and the sum of stayed (Left and Stayed column are made out of Churn with pd.get_dummies)
Any suggestions?
maybe i could take better approach than the difference of mentioned sums?
EDIT: i guess i have to make bins myself and than sum all of the Lefts, sum all of the Stayed for every bin and then subtract two values
in the plotly.express.density_heatmap — 5.9.0 documentation
we can read, that the value of Z may be series or array-like, but HOW to pass there a series of two columns - Stayed and Left?
i ended up with something like this:


giving any value to
histnorm gives no result, colors look identical,any ideas? anything to point?