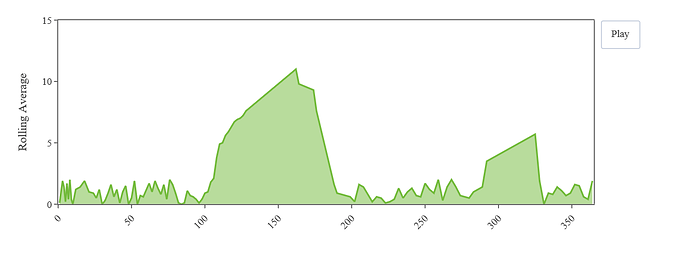
I am attempting to create a growing line animation using the tutorial on this page: https://plot.ly/python/filled-area-animation/ (except I did it in offline mode without using Grids).
The problem that I am now having is that I need to color parts of the line differently depending on my data, which basically looks something like this, with the days of the year going to 365:
Day of Year/ Prediction / Value
1 / 1 / 1.2
2 / 1 / 2.2
3 / 0 / 9
4 / 0 / 17
5 / 1 / 3.4
If the Prediction is 1, I need the line to be green, and if it is 0, I need the line to be red. The line in general is plotting the value (rolling average) for each day of the year.
I know it is not possible to color one trace with multiple colors, so I split the data such that each block of 1’s and 0’s is its own trace. However, the problem that I am now having is that each trace plots separately. As the animation progresses, the previous trace disappears once the next trace starts.
Is there a way to keep the previous traces on the screen?
The complete plot should look something like this, but with the peaks having red edges.
