I graphing storage usage which is usually presented as kilobyte, megabytes, gigabytes, etc. These units are multiples of 1024. However, the plotly default scale is in in multiples of 1000. Is there anyway to change the scale to multiples of 1024 and to use g for giga instead b for billion?
Hi @nagin,
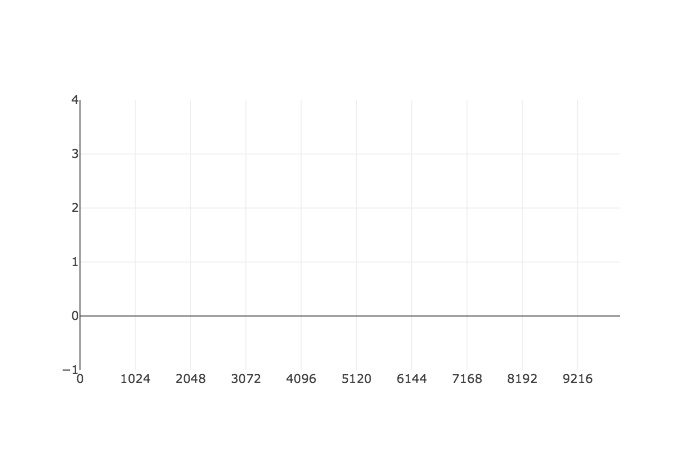
Here’s an example of making the ticks fall at intervals of 1024 using tick0/dtick.
import plotly.graph_objs as go
fig = go.FigureWidget(layout={'xaxis': {
    'range': [0, 1e4], 'tick0': 0, 'dtick': 1024, 'tickformat': 'd'}})
fig
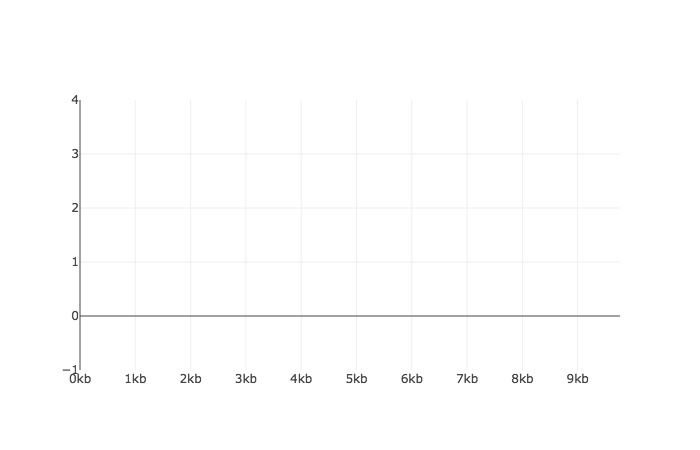
But I don’t think there’s a way to automatically add the kb/mb/gb suffixes (see options at https://github.com/d3/d3-format/blob/master/README.md#locale_format). If you need this, your best bet is probably to use custom tickvals/ticktext
import plotly.graph_objs as go
fig = go.FigureWidget(layout={'xaxis': {
    'range': [0, 1e4],
    'tickvals': [1024*i for i in range(10)],
    'ticktext': ["%skb" % k for k in range(10)]
}})
fig
Hope that helps!
-Jon
Hi, It’s possible to show in the tickformat like 30.000? But I got this.
