Hey guys,
I am having issue which the graph that is not showing in Dashboard.
There are two graphs in my dashboard, out of which first one (Map) takes input from user as dropdown and second one (bar graph) takes one more input from user as year in slider form but second graph is not showing up and there is no error in terminal.
Code:
app = dash.Dash(__name__)


app.layout = html.Div([
    html.Div([
        html.Label(['Demo Dash !'] , style = {'text-align':'center' , 'font-size':'100%' , 'color':'black' , 'font-weight':'bold'}),
        html.Hr(),
        dcc.Dropdown(
            id = 'demo-dropdown',
            options = [{'label':str(item) , 'value':str(item) } for item in sorted(df_copy['country_txt'].unique())],
            placeholder='Select a country...',
            style={"width": "50%"},
            value = "United States",
            optionHeight = 25,
            searchable= True,
            search_value= '',
            clearable =True
            )]),
    html.Div([dcc.Graph(id = 'id-graph1', config = {'scrollZoom' : True} , style = {'width':'50%'}),
             dcc.Graph(id = 'id-graph2' , style = {'width': '50%'})],
             #style = {'width':'50%', 'position':'absolute'}
            ),
    html.Div([ html.Pre('Filter by Year'),
            dcc.Slider(
                        id = 'the_year',
                        min= df_copy['year'].min(),
                        max= df_copy['year'].max(),
                        step= 1,
                        dots = True,
                        marks={item: str(item) for item in df_copy['year'].unique().tolist()[::3]},
                        value= df_copy['year'].min(),


                        #vertical = True
                    )

            ], style = {'width':'70%'})
         ])


@app.callback(
     Output('id-graph1', 'figure'),
    [Input('demo-dropdown', 'value')])
def update_output(value):
    df_sub = df_copy.loc[df_copy['country_txt'] == value]
    random.seed(1)
    #print(df_sub.head())
    #create graph

    location =[(go.Scattermapbox(lon = df_sub['longitude'],
                                 lat = df_sub['latitude'] ,
                                 mode = 'markers',
                                 marker=dict(size=5 , allowoverlap = False , opacity = 0.5),
                                 hoverinfo= 'lat+lon+text' ,
                                 opacity= 0.4 ,
                                 hovertext= df_sub['casualities_median'],

                                 customdata = df_sub['region_txt'],

                                 )) ]


    # return graph
    return {'data': location ,
            'layout': go.Layout(uirevision = 'foo' ,
                                hovermode = 'closest' ,
                                hoverdistance = 2 ,

                                mapbox =dict(accesstoken = mapbox_access_token ,
                                             style = 'open-street-map',
                                             center = dict(lat = random.choice(df_sub['latitude'].tolist()) , lon = random.choice(df_sub['longitude'].tolist())),
                                             zoom = 3
                                           )
                               )
           }
@app.callback(Output('id-graph2','figure'),
             [Input('the-year','value'),
              Input('demo-dropdown','value')])
def new_graph(year_value , drop_value):

    dff = df_copy.loc[df_copy['country_txt'] == drop_value].loc[df_copy['year'] == year_value]

    print(dff.head())

    fig = px.bar(dff['weapon_type'].value_counts()[:10])

    return fig

if __name__ == '__main__':
    app.run_server(debug = False)
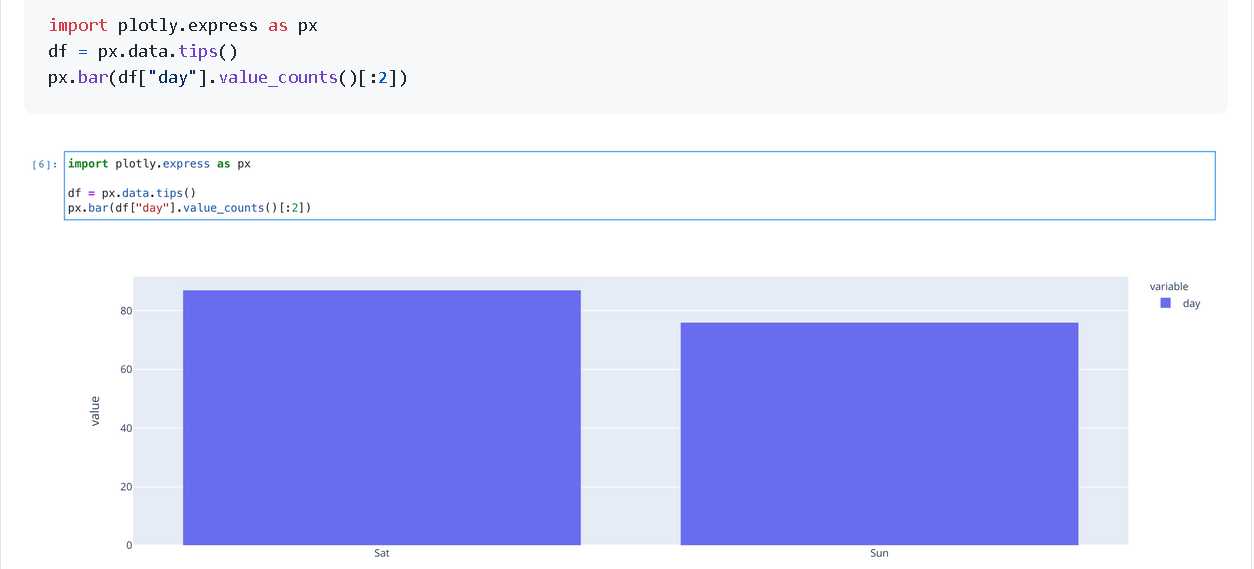
Screenshot of Dashboard:
Upper half of dashboard

lower half of Dashboard: