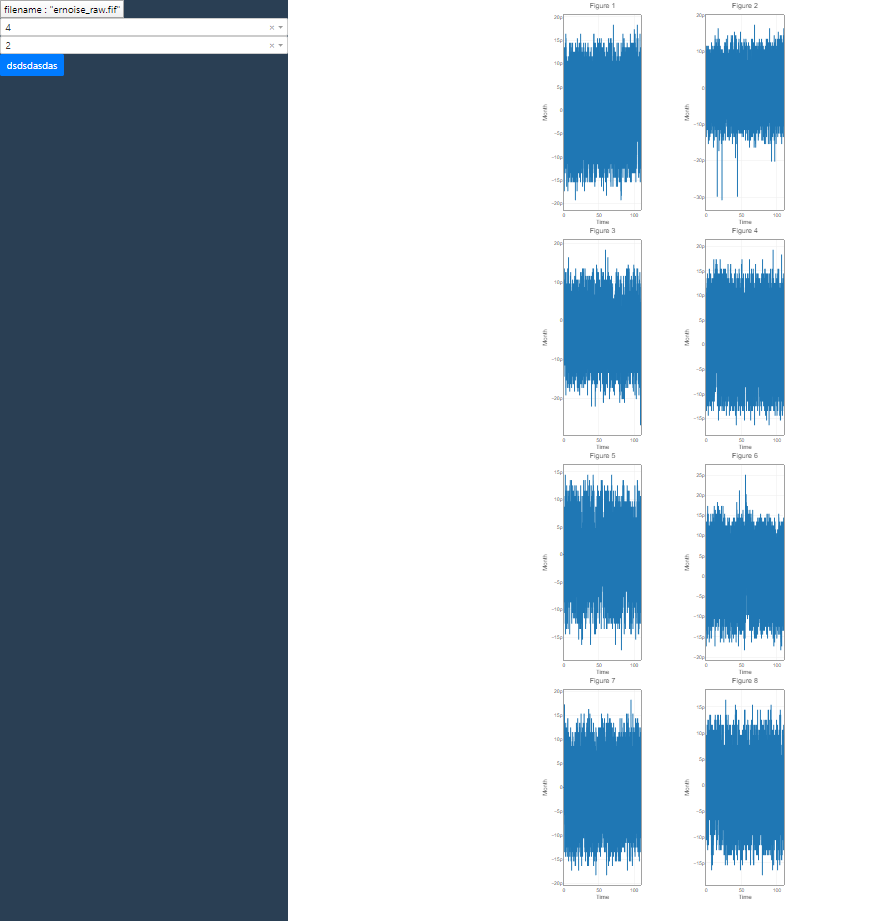
Hello I’m making website that let user select row and column and it will show brainwave data(I’m using mne-python for this) graphs in that row and column. But, there is some problem with my program. Let me show you the picture first. as you can see this one looks fine.
but if I change col from 2 to 3, graphs are missing. strange thing is only visualization is missing not data.

when I hover over the graph, it shows data of the graph just like other graphs that shows lines.

This is my first problem. Graphs are not visible.
Secondly, I have a problem with bootstrap grid organization of graphs. I used “col-3” for those upper pictures but this time, I used just “col” as className. Same as before, It works fine for 4rows 2col.

Now, if I change column value to 3 from 2, graphs are not organized as I expected and also graphs are lost just like before. I heard that bootstrap “col” will automatically organize the objects but my graphs are not being organized in right gird.

here is my code.
@app.callback(
    Output('eeg-graphs', 'children'),
    [Input('file-input', 'filename'),
     Input('row-dropdown', 'value'),
     Input('col-dropdown', 'value')]
)
def generate_graph(input_name, row, col):

    raw = mne.io.Raw(input_name, preload=True)
    print(raw.info)

    picks = mne.pick_types(raw.info, meg='grad', exclude=[])
    start, stop = raw.time_as_index([0, 150])

    n_channels = row * col
    data, times = raw[picks[:n_channels], start:stop]
    ch_names = [raw.info['ch_names'][p] for p in picks[:n_channels]]
    print("ch names : ", *ch_names)


    row_list = []
    col_list = []
    i = 0
    #append to row_list with className = "row"/ using bootstrap
    for r in range(0, row):
        #append to col_list with className = "col"/ using bootstrap
        for c in range(0, col):
            col_list.append(html.Div(className = "col",
                                  children = [dcc.Graph(
                                    style={'width': '100%', 'height': '100%'},
                                    # config={'displaylogo': False, 'editable': True, 'displayModeBar': False},
                                    id='graph-{}'.format(i),
                                    figure=dict(
                                        data=[dict(
                                            x=times, y=data.T[:, i], type='scattergl'
                                        )],
                                        layout=dict(
                                            title='Figure ' + str(i + 1),
                                            font=dict(family='Arial, monospace', size=10),
                                            autosize=True,
                                            margin=dict(l=50, r=50, b=30, t=30, pad=0),
                                            yaxis=dict(title='Month', linewidth=1, mirror=True),
                                            xaxis=dict(title='Time', linewidth=1, mirror=True),
                                        ))
                                    )]
                                    )
                                  )
            i+=1
            print("=================col_list" , *col_list)
        row_list.append(html.Div(className = "row",
                                     id = 'row-{}'.format(r),
                                     children = col_list))
        col_list = []
        print("===============row_list", len(row_list))

return row_list
I stack up graphs is same row in col_list with className “col” and append it to row_list with className “row”.
here is my layout code. This is where my output of callback function returns.
html.Div(className = 'right_content',
             children = [
                 html.Div(className = "container", id = 'eeg-graphs')
                 ]
        ),
Please help me find the solution for these two problems which are,
- some of graphs’ visualizations are missing!!
- bootstrap grid does not work properly
and I tried to use subplots method but I’m thinking of website that if user click on specific graph on the screen, graph changes background color and gets selected. And If user press some button, selected graphs will show on the other window. I thought subplot is not suitable for updating individual graphs by callbacks. That’s why I divided all graphs in separate dcc.Graph. If I’m thinking wrong, please correct me.
Also if you have any ideas for better structure for the code, or If you think there is better way to do this, please feel free to tell. I’m new to Dash-Plotly so any help is welcomed.