Hi, I’m new to plotly.
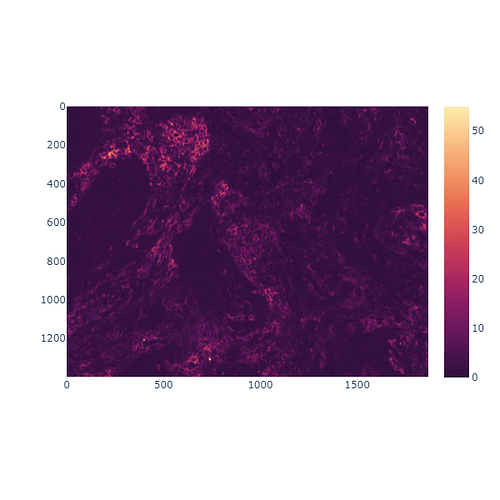
I’m trying to visualize a few single channels from my multichannel image.
Image can be downloaded here.
Read me for the images can be found here.
When I run the code the images do not display. Any ideas what I am doing wrong? I find px.imshow() works for rendering my images; however, I need to use go objects with subplots right? Or am I miss understanding that?
from plotly.subplots import make_subplots
import plotly.graph_objects as go
from skimage import io

img = io.imread("LuCa-7color_[13860,52919]_1x1component_data.tif", plugin="pil")

fig = make_subplots(
    rows=1, cols=3)

fig.add_trace(go.Image(z=img[0]), 1, 1)
fig.add_trace(go.Image(z=img[1]), 1, 2)
fig.add_trace(go.Image(z=img[2]), 1, 3)

fig.show()

