Using this gist as an example, how can I add an image to each subplot?
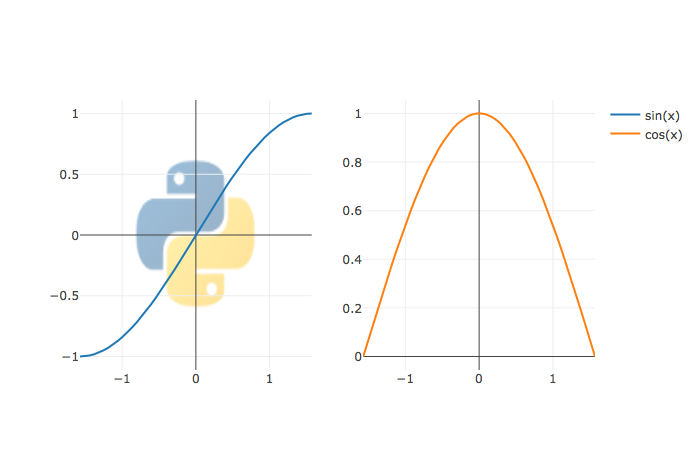
Update only seems to change the 1st plot.
Using this gist as an example, how can I add an image to each subplot?
Update only seems to change the 1st plot.
Never mind; figured it out
img = dict(
     ...
     xref="x"
     yref="y"
)

img2 = img.copy()

img2.update(dict(
     xref="x2"
     yref="y2"
)

...

images = [img1, img2]