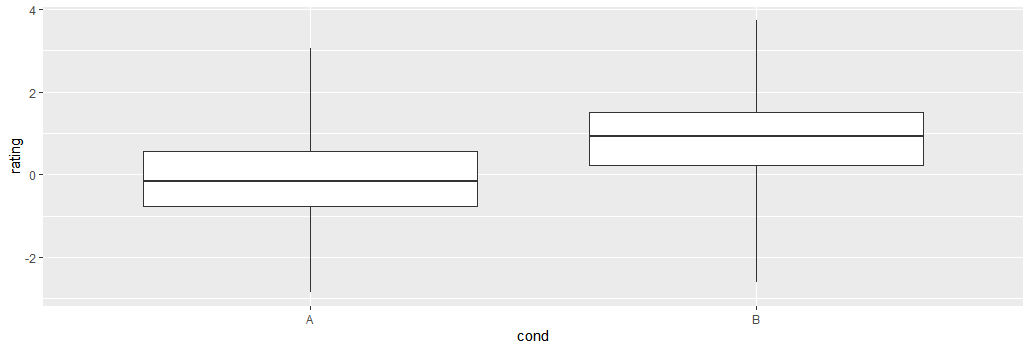
This is what I expect and what I get with ggplot:
set.seed(1234)
dat <- data.frame(cond = factor(rep(c("A","B"), each=200)), rating = c(rnorm(200),rnorm(200, mean=.8)))
p <- ggplot(dat, aes(x=cond, y=rating)) + geom_boxplot(coef=6)
p
when I convert this to plotly with ggplotly()
set.seed(1234)
dat <- data.frame(cond = factor(rep(c("A","B"), each=200)), rating = c(rnorm(200),rnorm(200, mean=.8)))
p <- ggplot(dat, aes(x=cond, y=rating)) + geom_boxplot(coef=6)
p
fig <- ggplotly(p)
fig
This is what I get. The coef=6 parameter defined in geom_boxplot() is totally ignored.

