Hello All!,
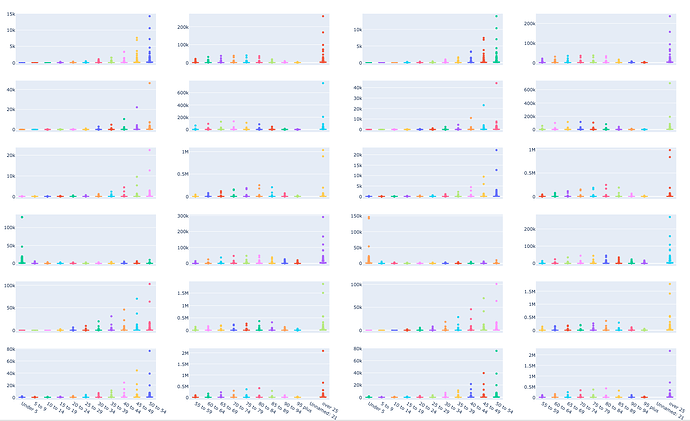
I have that kind of box subplots and want to add title for each of these,
Here is code,
    """build grid where to plot graphs"""
    rows = len(to_dict_)
    print(f'rows: {rows}')
    cols = 4

    fig = make_subplots(rows=rows,
                        cols=cols,
                        shared_xaxes=True,
                        vertical_spacing=0.04,
                        print_grid=False,
                        )
    """loop over list of dictionnnary items"""


    cpt = []

    for i in range(len(to_dict_)):
        word = to_dict_[i]['word']
        indices = to_dict_[i]['indices']
        years = to_dict_[i]['year']
        #print(f'indices: {indices}')

        for j in range(len(indices)):
            indice = indices[j]
            year = years[j]
            print(f'indice: {indice}')
            df = pd.DataFrame(l_of_dfs[indice])
            df_new_scope = df.iloc[1:, 1: -2]

            nb_cols = len(df_new_scope.columns)

            list_of_df_new_scope = [df_new_scope.iloc[:, 0: nb_cols//2], df_new_scope.iloc[:, nb_cols//2:]]

            for k in range(len(list_of_df_new_scope)):
                df_temp = list_of_df_new_scope[k]
                cpt.append(k)

                for l in range(len(df_temp.columns)):

                    feature = df_temp.columns[l]

                    fig.add_trace(go.Box(name=feature,
                                         y= df_temp[feature].values,
                                         ),
                                  row= i + 1,
                                  col= len(cpt),
                                 )
                    # fig.add_annotation(xref=str(i + 1),
                    #                    yref=str(len(cpt)),
                    #                    x=0,
                    #                    y=0,
                    #                    text=word)

                    fig.update_layout(height=1200, width=2000)


        print(f'cpt: {cpt}')
        cpt = []


    return fig
If I understand correctly, I need xref and yref for subtitles to be added to proper subplot.
But I unable to access fig.layout (I do not know how to deal with) data and get axis coordinates,
Have you some ideas and good practices to suggest ?
Many thanks for your help !
