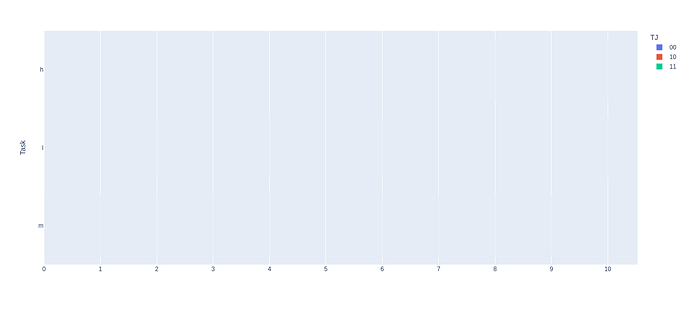
My code:
import plotly.graph_objs as go
import plotly.figure_factory as ff
import plotly.express as px
import pandas as pd
import numpy as np

import hashlib

df = pd.DataFrame({'Task': ['m','m','l','m','l','m','m','l','m','l','m','m','h','m','h'], 'Start':[3,4,6,9,10,0,1,2,2,4,6,7,8,8,10], 'Finish':[4,6,10,10,12,1,2,4,3,5,7,8,10,9,11], 'TJO':['000','001','002','003','004','100','101','102','103','104','110','111','112','113','114']})
tempList = []
for index in df.index:
    tempList.append(df['TJO'][index][0:2])
df['TJ'] = tempList
print(df)
fig = px.timeline(df, x_start="Start", x_end="Finish", y="Task", color="TJ")
fig['layout']['xaxis']['tickformat'] = '%L'
fig['layout']['xaxis']['tickvals'] = np.arange(0,20)
fig['layout']['xaxis']['ticktext']  = list(range(len(fig['layout']['xaxis']['tickvals'])))
fig.layout.xaxis.rangeselector = None
fig.layout.xaxis.type = 'linear'
fig.show()
The graph is empty. What should I do?
