✨ Create your data app within minutes with
Plotly Studio
Plotly Community Forum
Gantt chart horizontal axis without date
plotly.js
tasmin
September 25, 2018, 8:05am
1
Screen Shot 2018-09-18 at 1.20.52 PM.png
828×372 7.6 KB
Screen Shot 2018-09-25 at 1.03.08 AM.png
737×266 16.5 KB
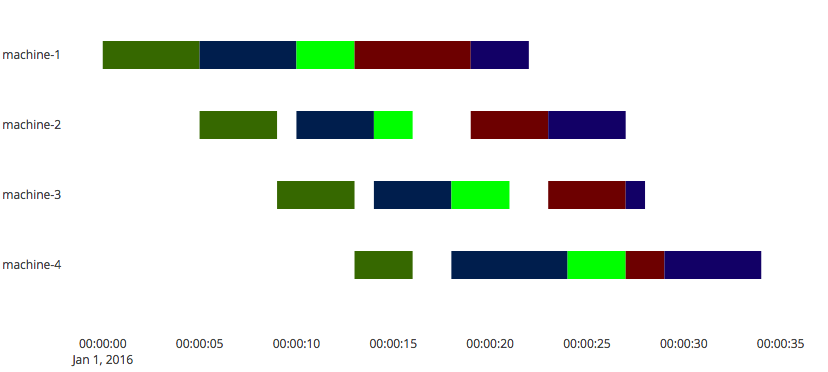
Hello, I was wondering if I could make a gantt chart without dates in the horizontal axis, I just want it to go like the picture I attached.
krerkkiat
December 5, 2019, 2:50am
2
The following works for me.
fig.update_xaxes(type='linear')
with integer value for Start and Finish.
Related topics
Topic
Replies
Views
Activity
Gantt Chart integer/float x axis labels instead of date
📊 Plotly Python
2
3518
April 12, 2023
How to plot durations (start time-finish time) as a horizontal lines
📊 Plotly Python
4
5167
January 30, 2022
Vertical line to mark today's date in gantt
Dash Python
0
971
December 14, 2020
Plotly Gantt charts
📊 Plotly Python
0
256
June 1, 2021
Gantt chart not displaying the bars
📊 Plotly Python
2
643
April 10, 2024