By @marthacryan ,
Read this article on the Plotly blog.
Jupyter notebooks are a mainstay of modern data science. What started as a side project by a graduate student in Physics has grown into a rich ecosystem of tools and an enthusiastic worldwide community — one that Plotly has been proud to be part of. Given our dedication to supporting data science initiatives, we knew how much our community valued extensive support for Jupyter, and we’re now bringing Plotly’s notebook support forward for the latest era.
The latest version of Plotly’s charting libraries have brought us up to date with modern Jupyter extensions and standards, and our new release is a great step forward for Plotly developers working in notebooks. anywidget support means notebook developers can incorporate Plotly charts as widgets in a wider variety of notebooks, while deprecation of Jupyter <7.0 will make it easier to install Plotly for Jupyter and for us to release new updates in the future.
Support for creating interactive plugins with anywidget
The big change in our new release is support for anywidget, a wrapper around the older ipywidget interface that offers a simple API for building add-ins for notebooks. anywidget enables developers to create interactive plugins that can send information to a notebook’s Python kernel and process the kernel’s replies, which in turn allows a Plotly chart to be updated in a separate notebook without having to re-render it.
While Jupyter widget support has been available for some time, using anywidget under-the-hood means developers can use Plotly as an interactive component in a variety of notebook interfaces and use the fantastic anywidget API for constructing interactive patterns in notebooks. Several Python notebook interfaces have already adopted anywidget as a framework for creating custom UI elements, so switching to it allows us to support a wider range of notebook users. We’re really excited to see what developers build by leveraging Plotly as a widget in various notebooks!
To use Plotly figures as anywidget components, just wrap your figure in the FigureWidget class:
import random

fig = px.scatter(x=range(0, 10), y=random.sample(range(0, 10), 10))

widget = go.FigureWidget(fig)

widget
Now, if you update any attribute (including the data) in your figure in a different cell, you’ll see your chart update without having to re-run the cell:
widget.layout.title = "Hello, FigureWidget!"
Our original documentation for FigureWidget remains as relevant as ever: If you haven’t taken it for a spin yet, there’s never been a better opportunity.
Plotly already had a FigureWidget class that relied on the ipywidgets package. We have rewritten FigureWidget to use anywidget instead, so other than needing to install a different dependency, extension authors shouldn’t need to make any changes.
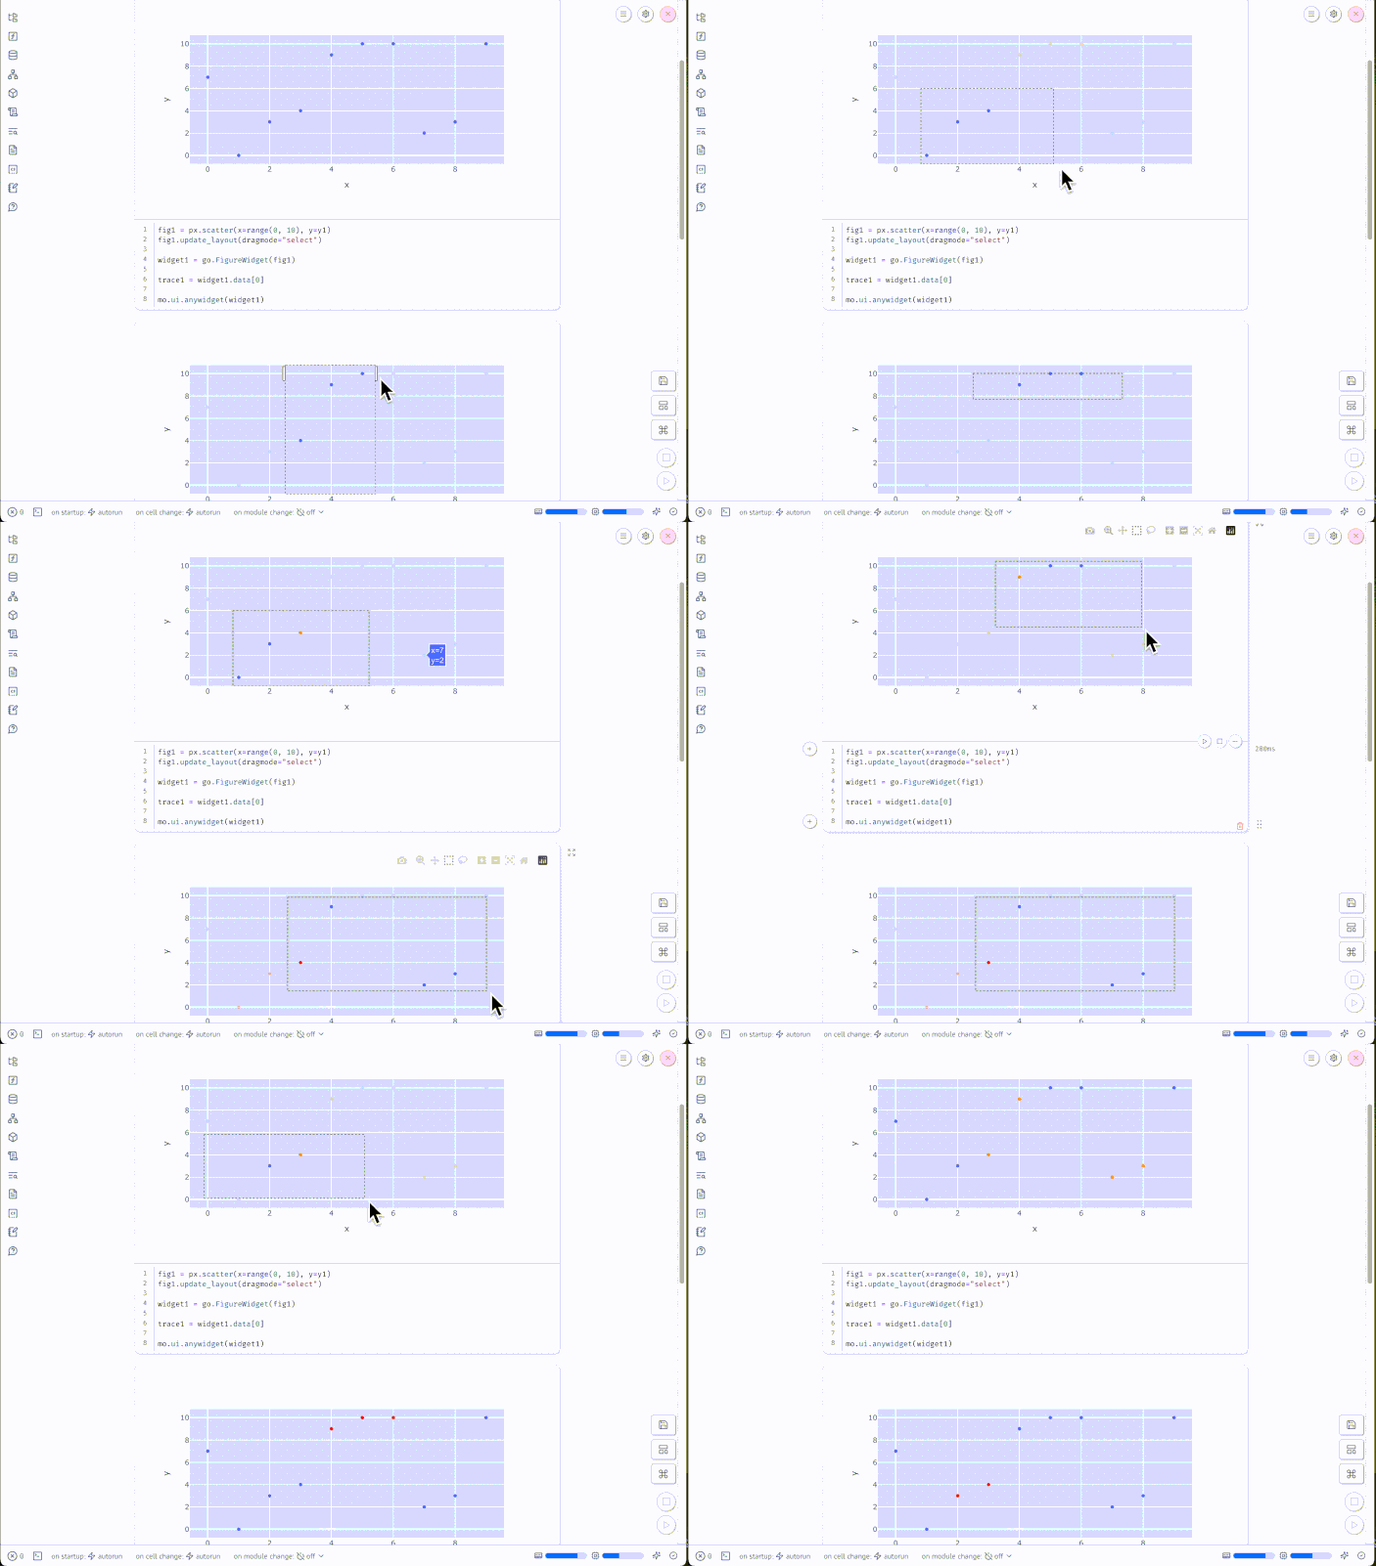
Here is a short example using two Plotly figures to cross-filter each other in both Jupyter and marimo. Without leaving your notebook, you can create an interactive project in which selecting points in one chart highlights them in another. Take this idea and run with it: here at Plotly we love cross-filtering, and making it easier to build these types of interfaces in all sorts of notebooks is something we’re really excited about.

Widget support makes building interactivity in notebooks easy, and AnyWidget support means using Plotly charts as interactive components is possible in far more notebook types.
Of course, if you’re trying to build more complex interfaces or apps, there’s always Dash, our complete web framework, which pairs beautifully with Dash Enterprise, the Enterprise hosting platform for all things Plotly.
We’re excited by the possibilities this unlocks, and look forward to all the unexpected uses our community will find for it. If you have an example you’d like to share, please get in touch.
Jupyter Notebook and JupyterLab extension support
JupyterLab 1 and 2 as well as Jupyter Notebook classic before version 7 required extension authors to publish extensions on npm (the world’s most widely used repository of JavaScript packages). Newer versions of Jupyter don’t require this, so we no longer do either, and the new release of our charting libraries deprecates our npm extension. In fact, Jupyter hasn’t required the npm package for a while, which led to users getting confusing warnings when they tried to use it; we hope that eliminating these messages will make for a smoother experience.
At the same time, the Jupyter team has done a lot of work to consolidate numerous parts of their tooling into one extension system. Jupyter Notebook 7 and JupyterLab 4, Voilà, nbviewer, and other tools are now slimmer and more consistent, so we’ve modified our code to take advantage of this. While these changes won’t be as obvious, they make our code easier to maintain, which will make future releases easier to get out the door.
To learn more about the exciting updates coming to Plotly and Dash, sign up for our webinar.