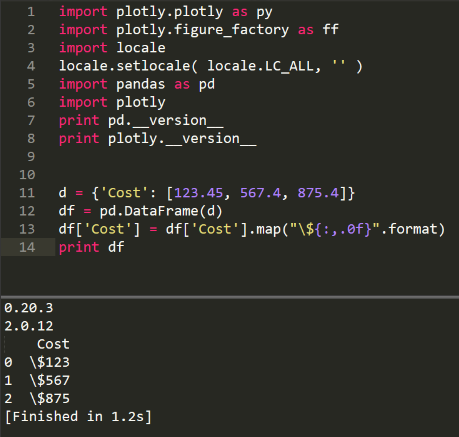
I’m trying to add currency values (in US dollars $) to Plotly table using Python. If I use this operator to format a dataframe column: campaigns_df['Cost'] = campaigns_df['Cost'].map("${:,.0f}".format)
Worst case, we’re about 1 week from having native plotly.js tables, which will definitely have broader character support. You can see a preview here: https://github.com/plotly/plotly.js/pull/1834
The current Python tables are a bit of a hack using plotly.js heatmaps and annotations.
@Viola I realized that this distinct behaviour manifests because I ran the code in a Jupyter Notebook, that renders LaTeX. Pandas works with ASCII code for dollar in Python 2.7, and unicode in Python 3.
Hence just try this version, that worked for me in Python 2.7:
I’ve just modified the code for an answer to other user that was interested in subplots of tables and with the last version it worked: https://plot.ly/~empet/14372. Try to list the content of your column of interest, after conversion to str and insertion of '\x24' as prefix. Maybe there is something wrong.