Scenario:
- User invokes data query and the
dcc.Graph is successfully generated.
- User invokes another data query and the
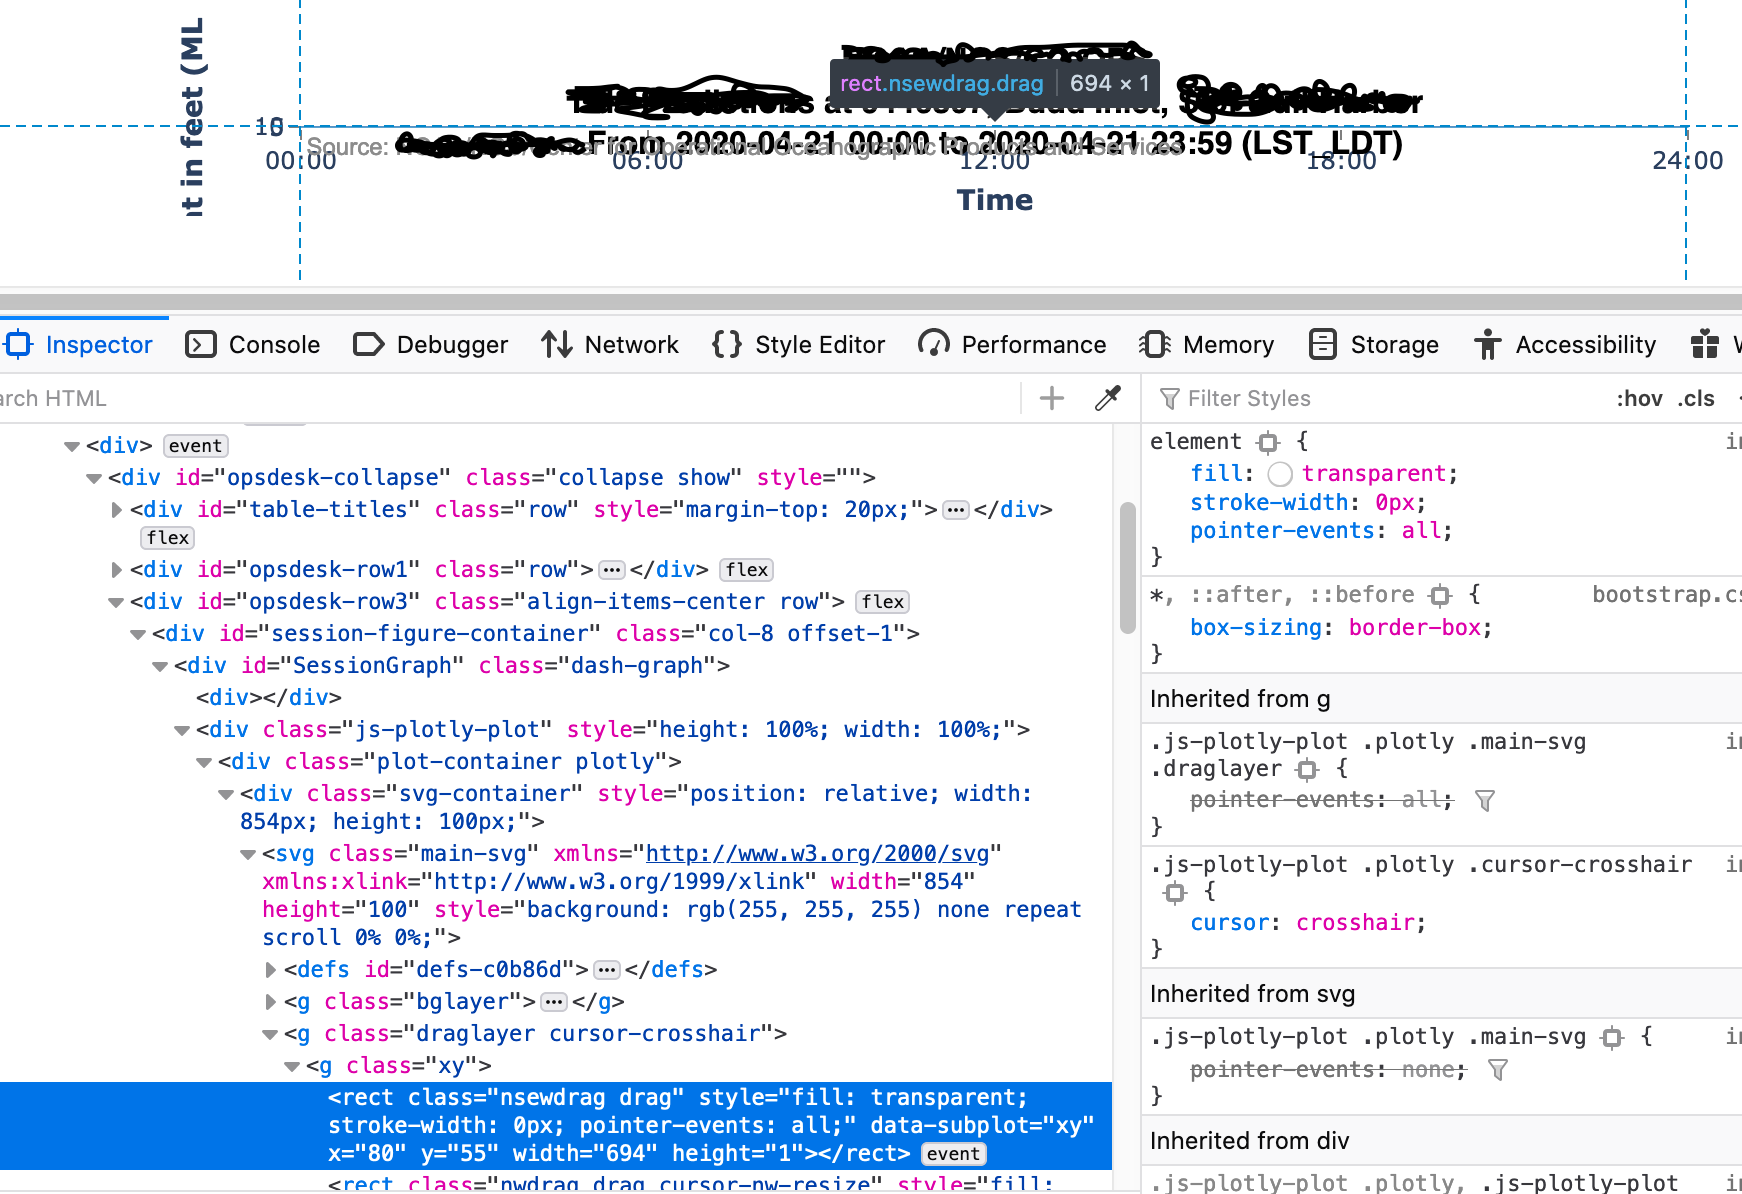
dcc.Graph shown below is returned, with the y-axis set to 1.
If the range of the y-axis is set, the problem still persists.
Has anybody else experienced this problem or have a suggestion on how to resolve it? It occurs on Chrome or Firebox browers so I don’t think it’s a browser issue.
I’m using Dash v1.11. I’m currently working to provide a code sample to reproduce the problem.
Hi @flyingcujo yes it’d be great if you could reproduce the problem with a small standalone app. It seems that the figure height is set to 1, you could try to set the figure height explicitly in the layout.
Thanks @Emmanuelle for the suggestion. I’ll give that a try and report back. Hopefully I’m able to reproduce the problem via a standalone app.
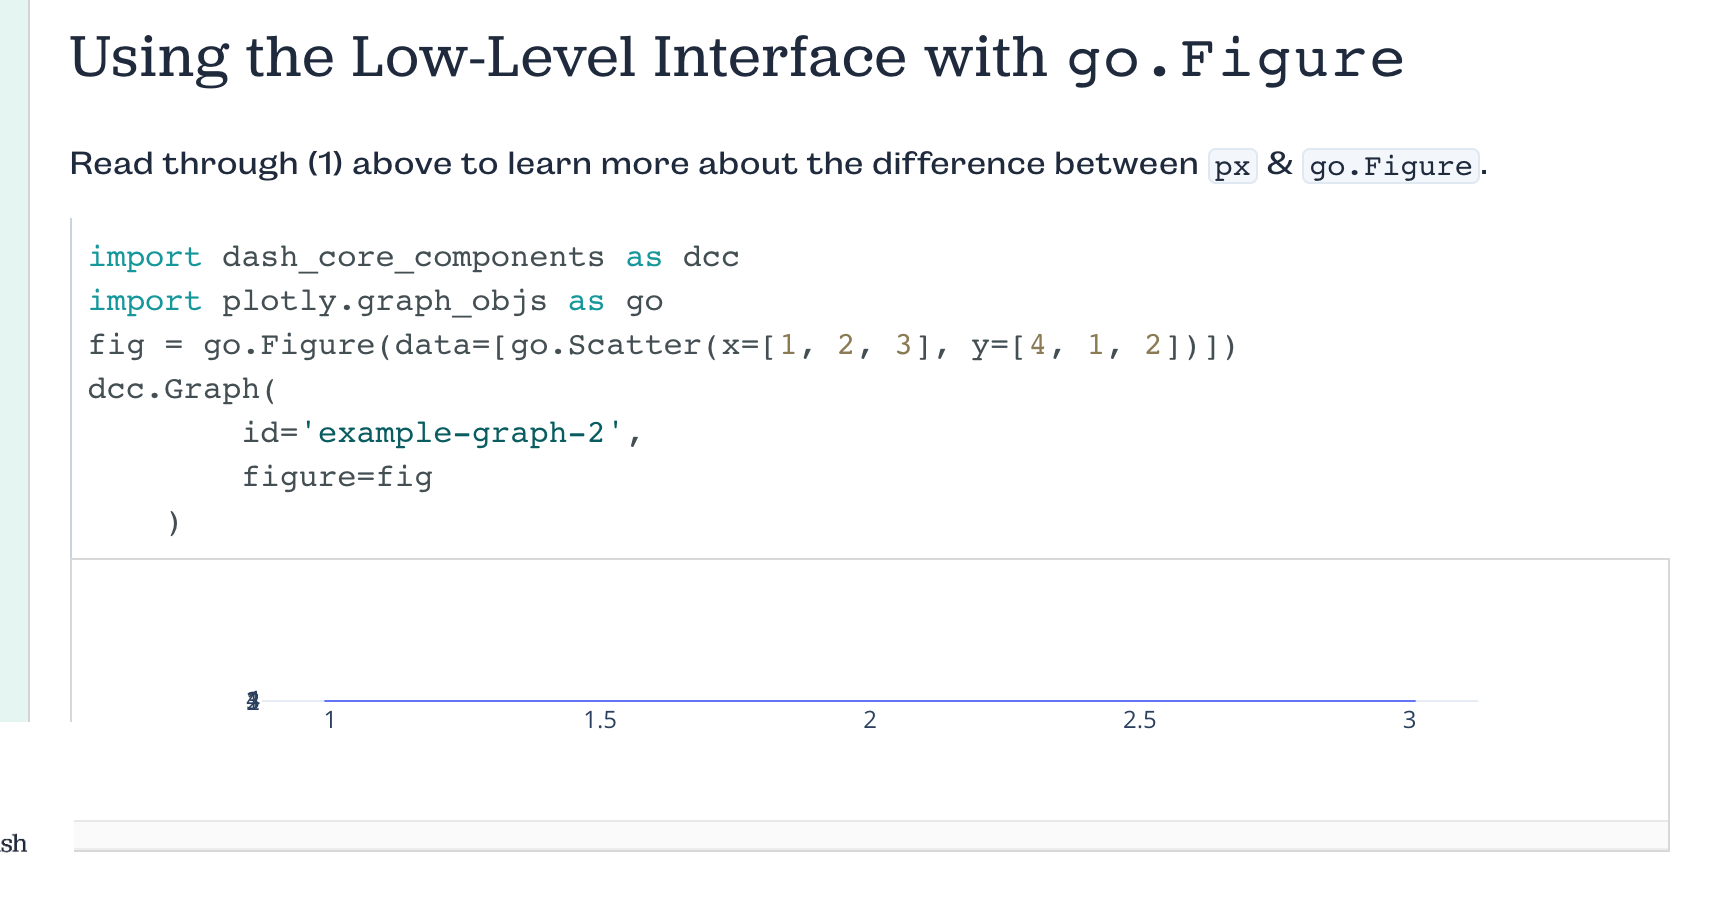
@Emmanuelle I see the same behavior on Dash’s examples (https://dash.plotly.com/dash-core-components/graph)…so I suspect this a browser problem - I see this on latest version of Chrome and Firefox. If I close the tab and navigate back to the Dash examples, the graphs display properly.
In my case, setting the figure height reduces the occurrence of this problem to about 10% of the time.