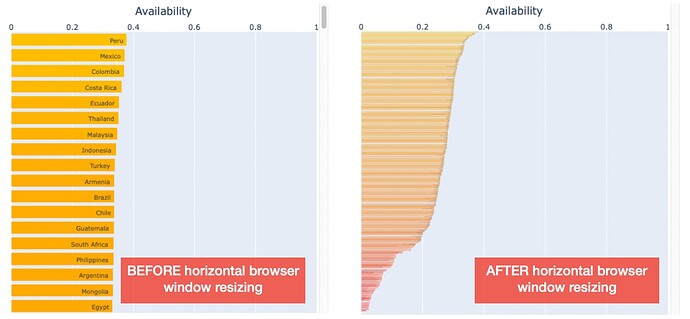
Hi there,
I have implemented a scrollable bar graph with the settings below and run into problems when the browser window is resized.
The desired outcome is:
- the figure fills the full parent element width
- the figure retains the height set via
px.bar.height/figure.layout.height - the height in
dcc.Graph.styleis applied properly such one can scroll through the figure
So far so good. I managed to make that work.
The problem is: When I resize the width of the browser window, the height of the figure (figure.layout.height) collapses down to the height of the parent (dcc.Graph.style.height) – which is undesired.
Sample data:
df = pd.DataFrame({
    "Country": [f"Country {n}" for n in range(100)],
    "Availability": [random() for n in range(100)]
})
Horizontal bar figure with 100 bars:
fig = px.bar(
    df,
    orientation='h',
    # implement quasi-constant horizontal bar height
    height = 120+25*len(df.index),
    [...])
Scrollable bar graph:
dcc.Graph(
    figure=fig,
    config={'responsive': False},
    style={'overflowY': 'scroll', 'height': 500})
For reference: Graph | Dash for Python Documentation | Plotly
Many thanks for your help,
Christoph
PS: I also wrote a minimal working example to reproduce the issue. Without setting setting the figure attribute of dcc.Graph via a callback, the figure got resized immediately (showed up for a fraction as desired and then got set to the height of the parent element). Setting the attribute with a callback reproduces the issue exactly a described above. You can find the minimal working example here.
