@Adam All graph will interact each other:)
2 Likes
Wow, all the dictionaries! Huge thanks ![]()
3 Likes
Awesome! Huge creativity, nice job!
1 Like
Hi, This week’s topic is very interesting, and it demonstrates the importance of having data dictionaries in a dataset. To explore the relationship between ‘Primary Causes’ and incidents, I propose two visualizations: the first, to understand how certain causes trigger evacuations; and the second, to identify which primary causes are the most frequent.


3 Likes
Fixed it, Snowdon, Berri and Jean-Talon are split up per line, which means 2 or 3 datapoints.
2 Likes
@adamschroeder Hi yes, here is the github link :
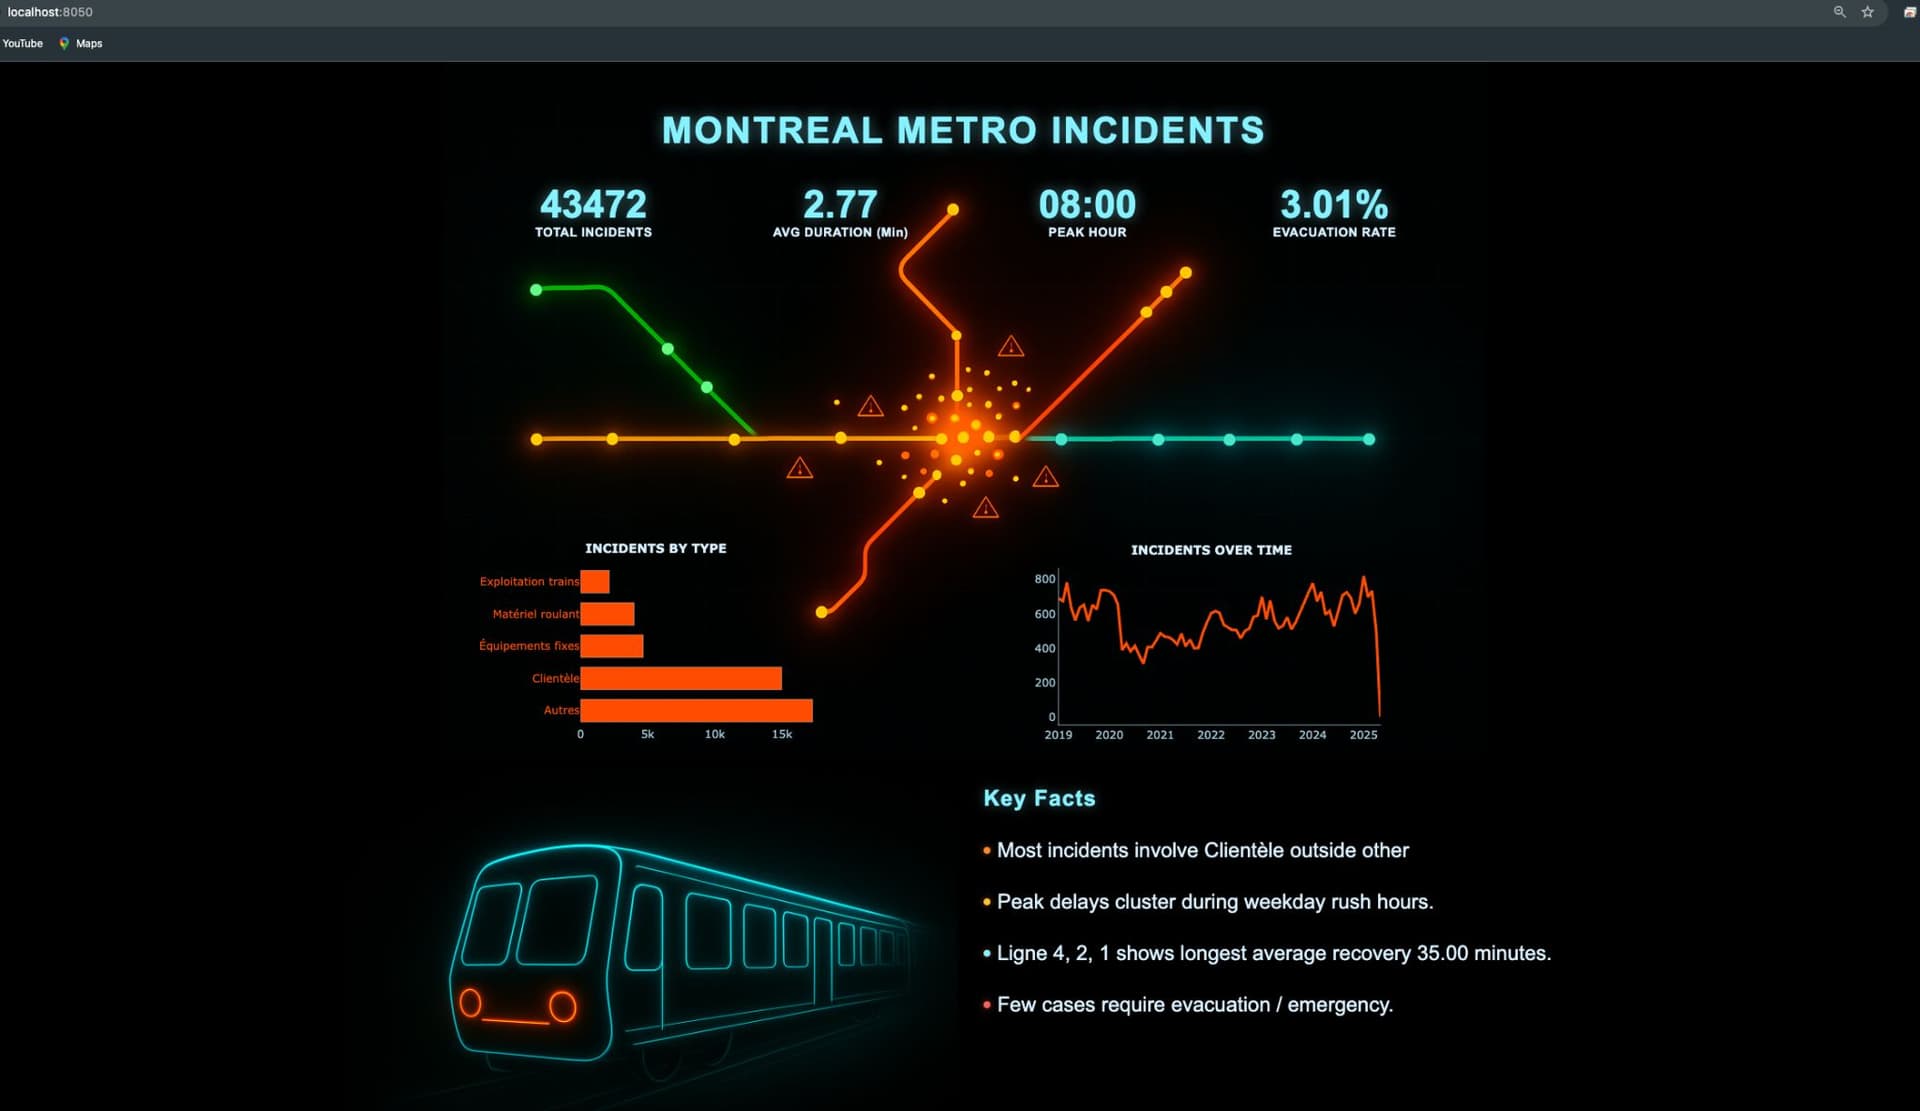
this just standar dash and bit play with CSS and image as illustrations. and rest of creativity
1 Like
Hi All. I want to share my simple dashboard app for this Metro incidents data. open for your opinion about the design. Thank you
thank youu
@U-Danny can you update the open application link please? I don’t think the app is public.
I love both visualizations, especially the second colorful one.
It’s tricky though - due to a Ebbinghaus illusion it looks like the green (clientele) reason is larger than the blue (Autres) reason, although it’s smaller by 6%.
1 Like