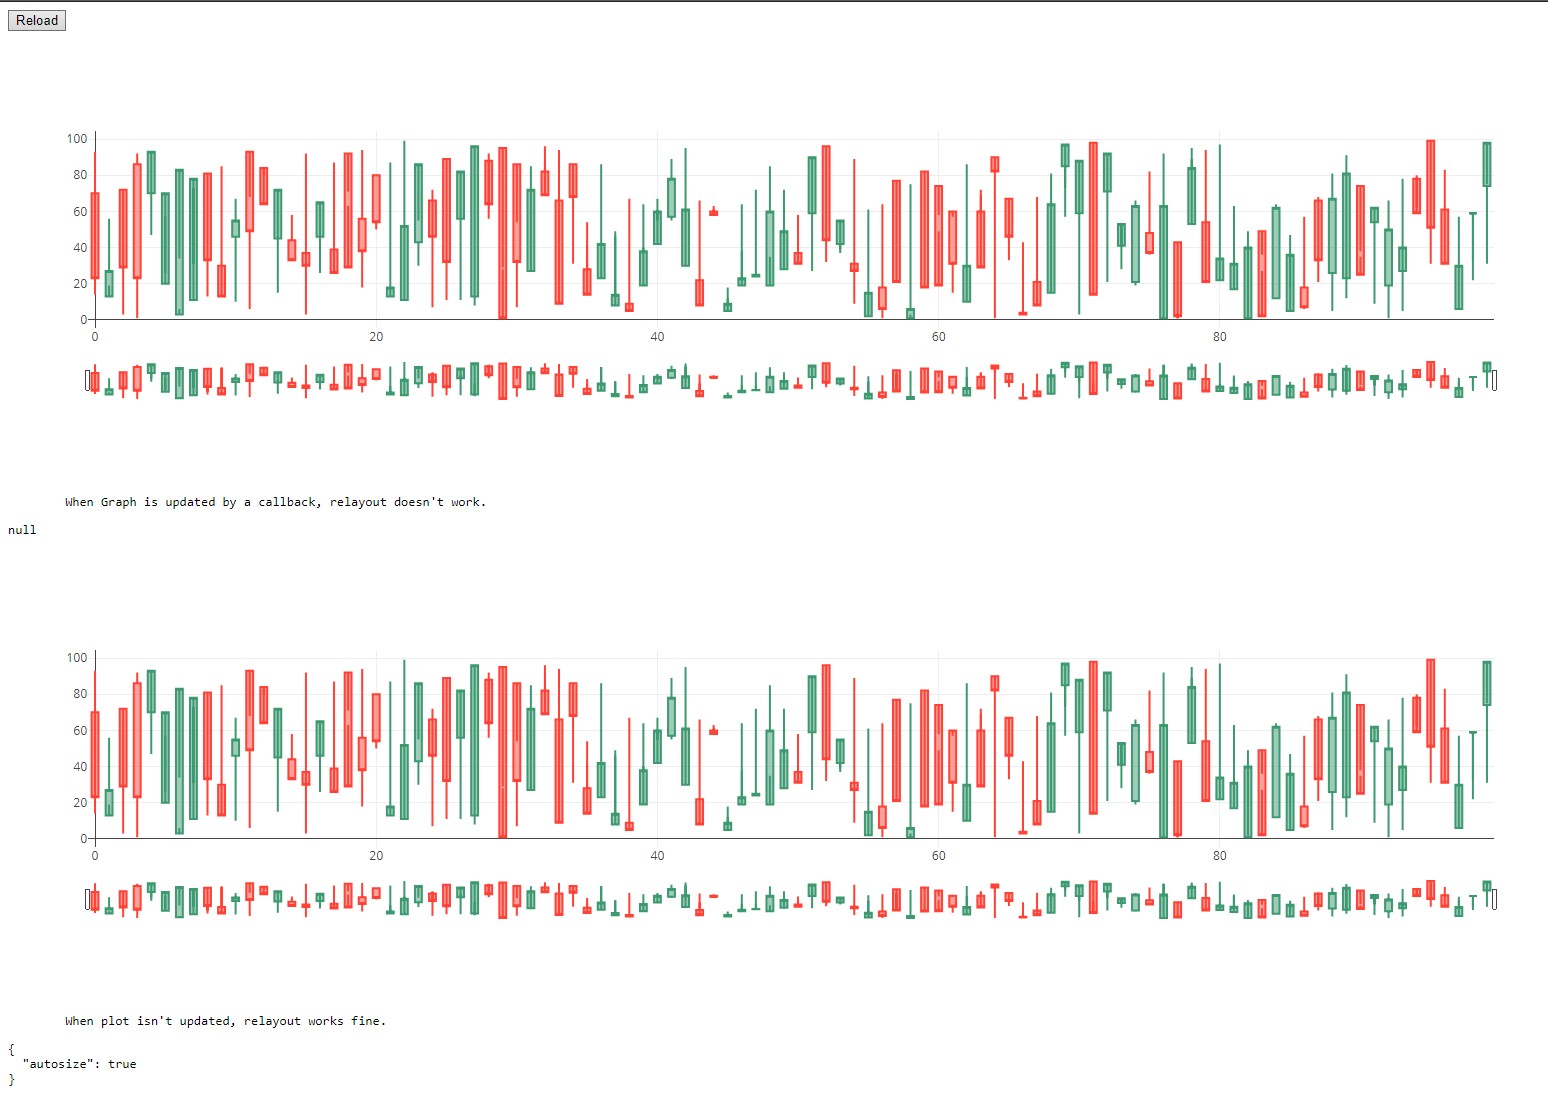
Thanks for the reply, Chris! This should work for what I want to do, but I’m still running into issues with getting the replyoutData callback to work with my candle plot. The behavior seems like a bug to me, but I’m not sure what’s going on so I figured I’d post here before creating an issue. replyoutData works if the plot isn’t being updated by a callback, but otherwise it just returns null. Check out my minimal example below. Am I doing something wrong here?
Here’s what I’m working with:
dash_core_components ==0.28.0
dash_html_components== 0.11.0
dash== 0.26.2
plotly== 3.1.1
Here’s the code:
import pandas as pd
import numpy as np
import json

import dash
import dash_core_components as dcc
import dash_html_components as html
from dash.dependencies import Input, Output
import plotly.graph_objs as go
import plotly


# Data to plot
# ------------------------------------------------------------------------------
candles = pd.DataFrame(np.random.randint(1,100, size = (100,4)),
                       columns = ['open', 'close', 'high', 'low'])


# App
# ------------------------------------------------------------------------------
app = dash.Dash()
serv = app.server

app.layout = \
html.Div([

    # relayoutData doesn't work
    # --------------------------------------------------------------------------
    html.Div([
        html.Button('Reload', id='button1')
    ]),

    html.Div([
        dcc.Graph(
            id='relayout_not_working',
        )
    ]),

    html.Div([
        dcc.Markdown("""
            When Graph is updated by a callback, relayout doesn't work.
        """),
        html.Pre(id='relayout-data1'),
    ], className='three columns'),


    # relayoutData works
    # --------------------------------------------------------------------------
    html.Div([
        dcc.Graph(
            id='relayout_working',
            figure = {
                'data':[
                    go.Candlestick(
                        x = list(candles.index),
                        open = candles.open,
                        high = candles.high,
                        close = candles.close,
                        low = candles.low,
                        name = 'Candles',
                    )
                ],
                'layout':[
                    go.Layout(
                        xaxis = dict(
                            rangeslider = {'visible':False}
                            )
                        )
                ]
                    }
        )
    ]),

    html.Div([
        dcc.Markdown("""
            When plot isn't updated, relayout works fine.
        """),
        html.Pre(id='relayout-data2'),
    ], className='three columns')
])


# Callbacks
#-------------------------------------------------------------------------------
@app.callback(
    dash.dependencies.Output('relayout_not_working', 'figure'),
    [dash.dependencies.Input('button1', 'n_clicks')]
    )
def update_plot(reload):
    figure = {
        'data':[
            go.Candlestick(
                x = list(candles.index),
                open = candles.open,
                high = candles.high,
                close = candles.close,
                low = candles.low,
                name = 'Candles',
            )
        ],
        'layout':[
            go.Layout(
                xaxis = dict(
                    rangeslider = {'visible':False}
                    )
                )
        ]
            }
    return figure

@app.callback(
    Output('relayout-data1', 'children'),
    [Input('relayout_not_working', 'relayoutData')])
def display_selected_data(relayoutData):
    return json.dumps(relayoutData, indent=2)

@app.callback(
    Output('relayout-data2', 'children'),
    [Input('relayout_working', 'relayoutData')])
def display_selected_data(relayoutData):
    return json.dumps(relayoutData, indent=2)


if __name__ == '__main__':
    app.run_server(debug=True)