I am running the tutorial assignments in Dash-by-Plotly/Good_to_Know/Dash2.0/Exercises at master · MichaelNair/Dash-by-Plotly · GitHub and I can’t seem to figure out the first assignement. I checked the solution given and it has the same issue. When I put 2 elements with different heights on the same row the taller one doesn’t render.
# Build your components
app = Dash(__name__, external_stylesheets=[dbc.themes.LUX])
mytitle = dcc.Markdown(children='')
mygraph = dcc.Graph(figure={})
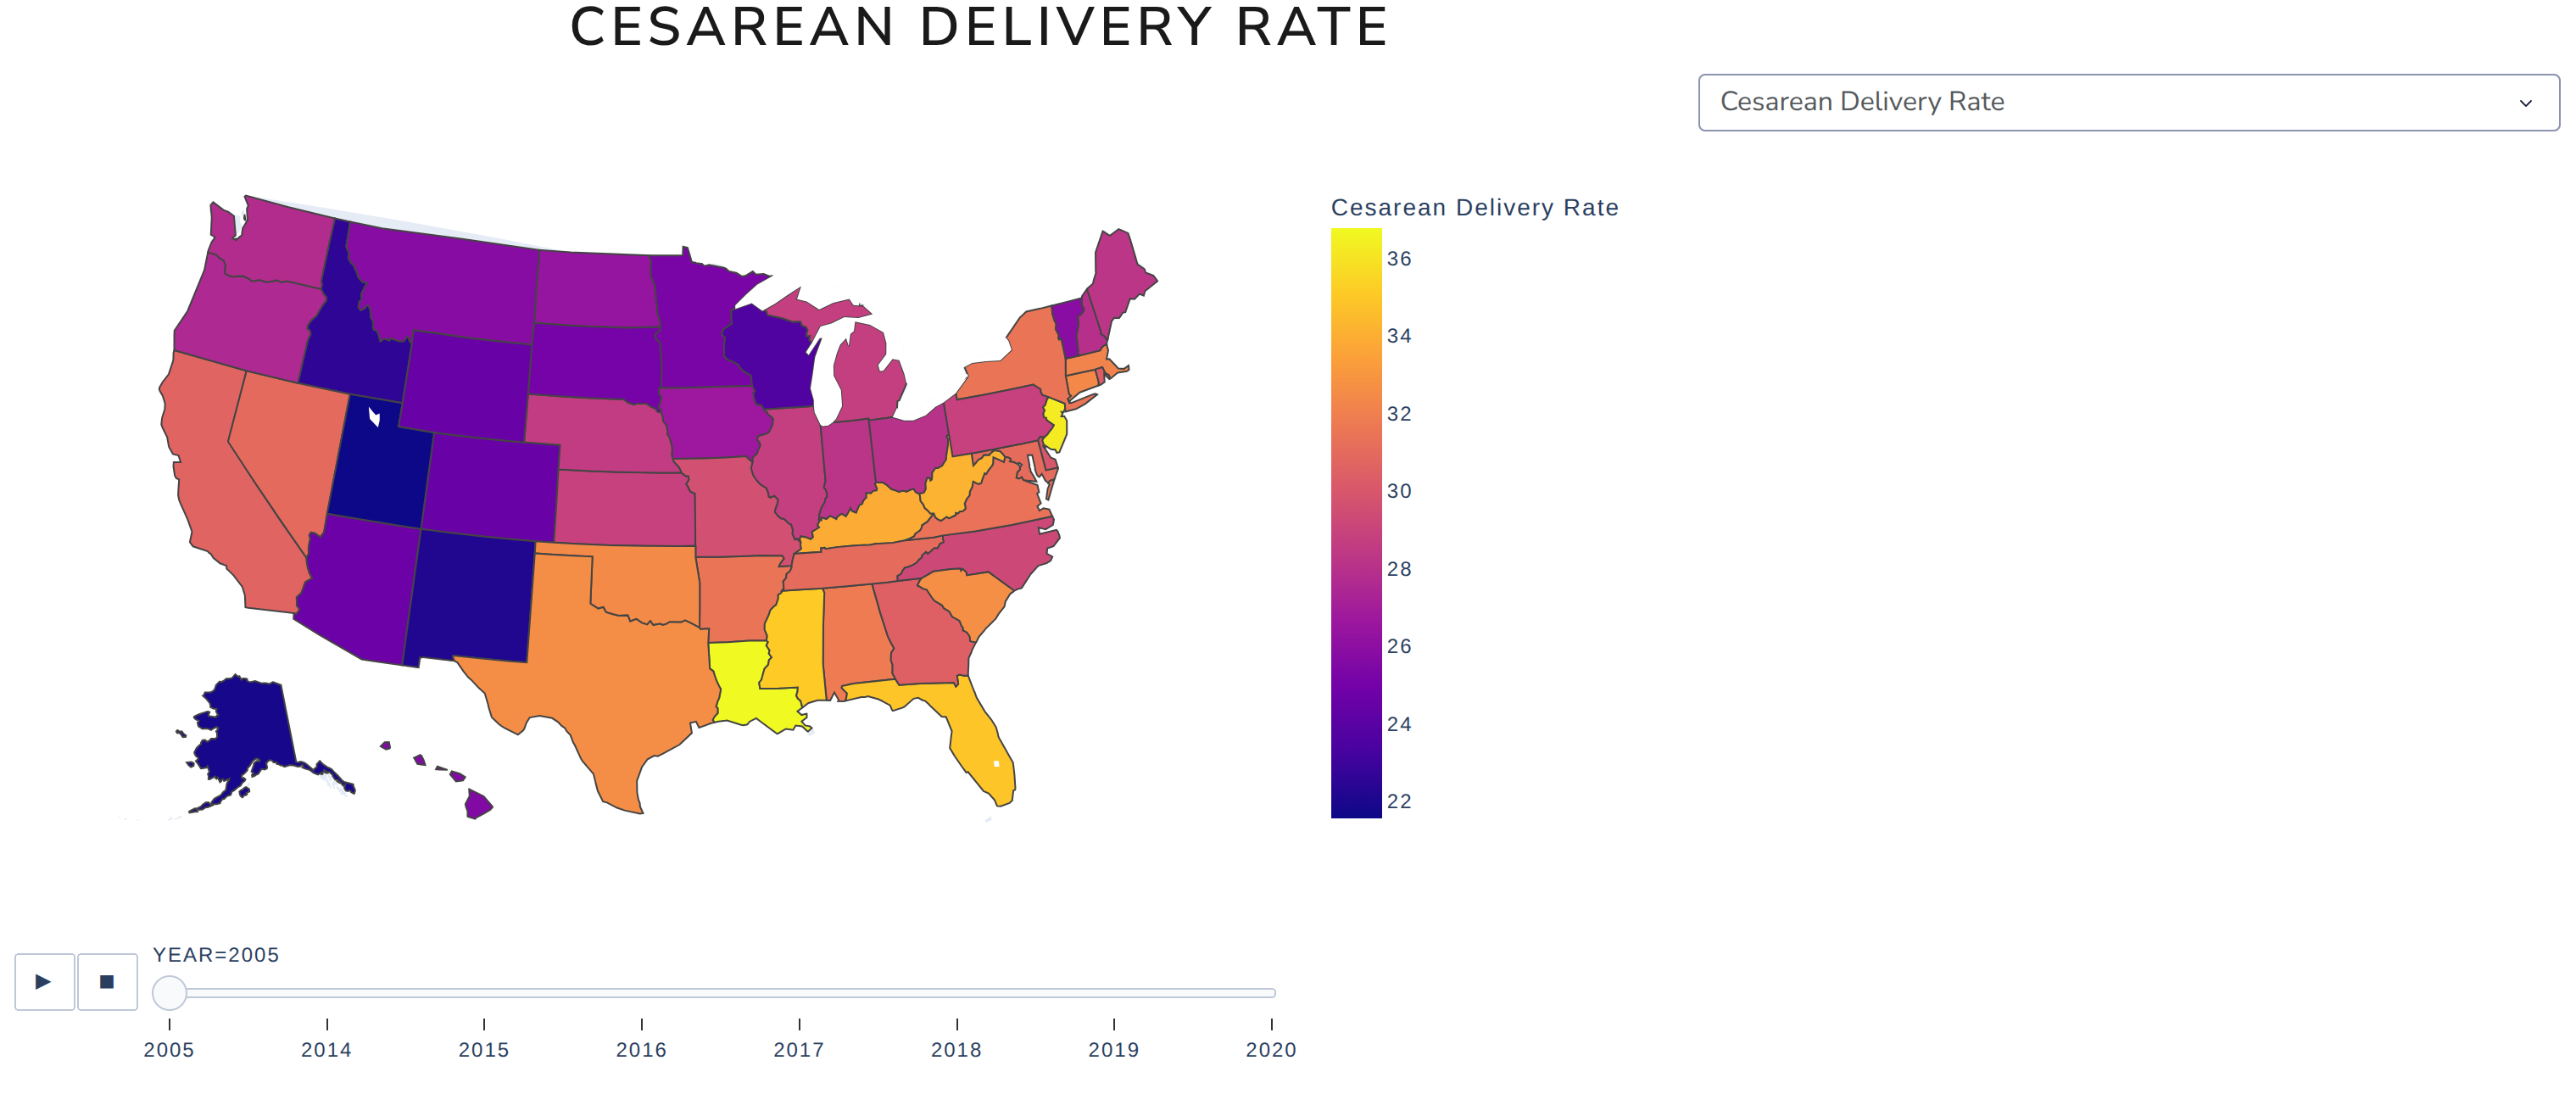
dropdown = dcc.Dropdown(options=df.columns.values[2:],
value='Cesarean Delivery Rate', # initial value displayed when page first loads
clearable=False)
# Customize your own Layout
app.layout = dbc.Container([
dbc.Row([
dbc.Col([mytitle], width=6)
], justify='center'),
dbc.Row([
dbc.Col([dropdown], width=3),
dbc.Col([mygraph], width=9),
]),
], fluid=True)
The inspecter error I get is:
Uncaught (in promise) Error: Something went wrong with axis scaling
    at t.setScale (plotly.min.js:20:175875)
    at Ryt (plotly.min.js:21:474199)
    at SVGGElement.<anonymous> (plotly.min.js:21:471485)
    at plotly.min.js:15:21400
    at Qt (plotly.min.js:15:21546)
    at Pe.each (plotly.min.js:15:21371)
    at Pyt (plotly.min.js:21:471139)
    at pd.drawMarginPushers (plotly.min.js:21:184222)
    at b (plotly.min.js:21:260409)
    at Mi.syncOrAsync (plotly.min.js:20:17595)