Dropdowns in plotly express chart filtering (default button)

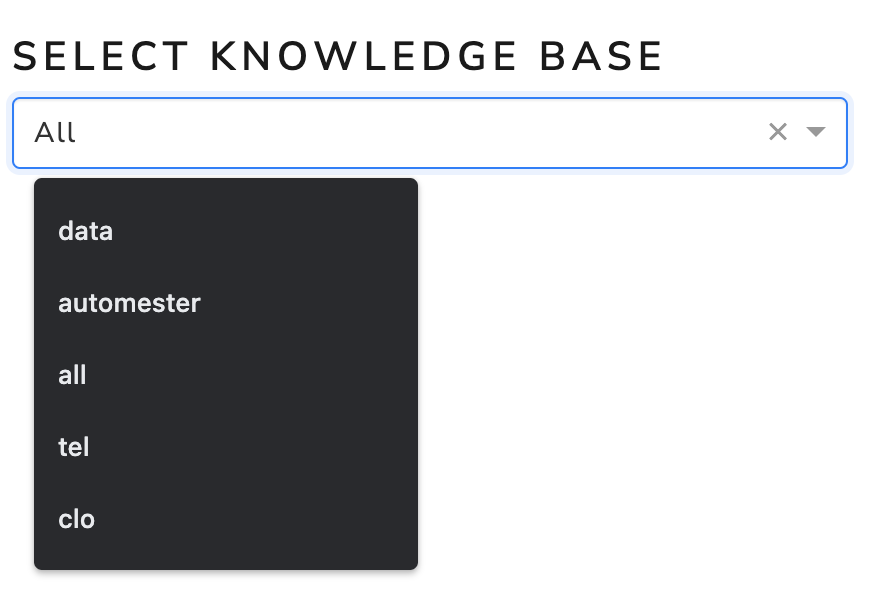
I made a line chart with way too many lines to neatly display, thus, I need to be able to select a grouping variable ( label ) and have it just display the lines in a given category.

For example, I would click A in the dropdown and have just the lines corresponding to category A show up. In the following, I have provided a working example. The dropdown works perfectly fine for all categories except when I want to go back to default All .

Does anybody know how to install a default button in the interactive dropdown filter?

import pandas as pd
import plotly.graph_objects as go
import plotly.express as px

d = {
    'num' : [1, 2, 3, 4, 5, 6, 7, 8, 9, 10, 11, 12, 13, 14, 15, 16],
    'label' : ['A', 'A', 'A', 'A', 'A', 'A', 'B', 'B', 'B', 'B', 'C', 'C', 'D', 'D', 'D', 'D'],
    'color' : ['red', 'blue', 'green', 'red', 'blue', 'green', 'blue', 'green', 'red', 'green', 'red', 'blue', 'red', 'blue', 'green', 'blue'],
    'value' : [0.4, 0.2, 0.3, 0.6, 0.7, 0.4, 0.2, 0.4, 0.4, 0.2, 0.1, 0.3, 0.8, 0.4, 0.6, 0.5]
    }

# Build dataframe
df = pd.DataFrame(data=d)

# Build dropdown Labels
labels = df["label"].unique()
buttonsLabels = [dict(label = "All",
                            method = "restyle",
                            visible=True,
                            args = [
                                {'x' : [df.num]},
                                {'y' : [df.values]},
                                {'color': [df.color]},
                            ]
                            )]

for label in labels:
    buttonsLabels.append(dict(label = label,
                              method = "restyle",
                              visible = True,
                              args = [
                                  {'x' : [df.loc[df['label'] == label, "num"]]},
                                  {'y' : [df.loc[df['label'] == label, "value"]]},
                                  {'color' : [df.loc[df['label'] == label, "color"]]},
                              ]
                              ))

# Display figure
fig = px.line(x = df.num, y = df.value, color=df.color)

fig.update_layout(updatemenus = [
   dict(buttons = buttonsLabels, showactive = True),
   ])

fig.show()

Hi @MotzWanted
:wave: welcome to the community.

It might be easier to do with Dash:

import pandas as pd
import plotly.graph_objects as go
import plotly.express as px
from dash import Dash, dcc, html, callback, Output, Input

d = {
    'num' : [1, 2, 3, 4, 5, 6, 7, 8, 9, 10, 11, 12, 13, 14, 15, 16],
    'label' : ['A', 'A', 'A', 'A', 'A', 'A', 'B', 'B', 'B', 'B', 'C', 'C', 'D', 'D', 'D', 'D'],
    'color' : ['red', 'blue', 'green', 'red', 'blue', 'green', 'blue', 'green', 'red', 'green', 'red', 'blue', 'red', 'blue', 'green', 'blue'],
    'value' : [0.4, 0.2, 0.3, 0.6, 0.7, 0.4, 0.2, 0.4, 0.4, 0.2, 0.1, 0.3, 0.8, 0.4, 0.6, 0.5]
    }

# Build dataframe
df = pd.DataFrame(data=d)

app = Dash(__name__)
app.layout = html.Div([
    dcc.Dropdown(['A', 'B', 'C', 'D'], 'A', multi=False, id='my-dropdown'),
    dcc.Graph(id='my-graph')
])


@callback(
    Output('my-graph','figure'),
    Input('my-dropdown', 'value')
)
def update_graph(label_selected):
    dff = df[df.label==label_selected]
    print(dff)
    fig = px.line(data_frame=dff, x='num', y='value' ,color='color')
    return fig

if __name__ == '__main__':
    app.run_server()

2 Likes

Thanks @adamschroeder. That’s a good workaround.

Do you know I can disable the view of former searches related to the dropdown?

Hi @MotzWanted
Are you referring to disable search?

No, I would like people to search, but I don’t want a box with earlier searches to pop up and block the whole dropdown. See the black box in the picture I have attached.

I’m not getting that earlier-search box that you are getting. Can you share your code with me and let me know which internet browser you’re using.

Weird. I’m using Google Chrome and here is the code:

# dropdown1
  dropdown1 = dbc.FormGroup([
      html.H4("Select Knowledge Base"),
      dcc.Dropdown(
          id="customer",
          options=[
                      {"label": "All", "value": "All"}] + [
                      {"label": ", ".join([name, str(idx)]), "value": idx} for (name, idx) in db.customers
                  ]
          , value="All",
          optionHeight=35)
  ])

Hi @MotzWanted
I’m still not getting the error you’re getting. But I’m using dbc v1.0.0. In my version the FormGroup component is deprecated, so you can’t use that anymore if you have that dbc version or higher.

What should I use instead?

See the migration guide for future needs.

In your case,:

  • Breaking Dropped FormGroup . It is no longer necessary to use FormGroup to align components in a form. Use Row Col and gutter modifier classes and spacing utilities instead. See the documentation for examples
2 Likes

Hi adam,

I using your this code to replicate in my dashboard.
In my data frame I have column ‘parcel_foriegn_id’ which has values 1,2,3 etc. I have put these values in drop down menu. I want to plot graph between s1product_end_time and ndvi_avg.
The end goal is when user select a value from drop down like 1,2,3 etc. It plot a graph of that particular parcel.

Upon using your code, it is giving me this error.

Empty DataFrame
Columns: [parcel_foreign_id_x, s1product_end_time, s1product_ron, cohvh_avg, cohvv_avg, vhvv_avg, parcel_foreign_id_y, s2product_start_time, s2product_ron, ndvi_avg]
Index: [ ]


]

Can you please help me where i am doing wrong. My code is as follows:

import dash
import dash_leaflet as dl
import geopandas as gpd
from dash import html, Input, Output
import dash_leaflet as dl
from dash_extensions.javascript import arrow_function, assign
import geojson
from dash import dcc
import plotly.express as px
import pandas as pd
import requests

with open('C:/Users/AbdullahToqeer/Desktop/dashboard data/map.geojson') as f:
    geojson_data = geojson.load(f)


df = pd.read_csv('parcel_info.csv')
df1=df

external_stylesheets = ['https://codepen.io/chriddyp/pen/bWLwgP.css']
app = dash.Dash(__name__, external_stylesheets=external_stylesheets)

classes = [0, 10, 20, 50, 100, 200, 500, 1000]
colorscale = ['#FFEDA0', '#FED976', '#FEB24C', '#FD8D3C', '#FC4E2A', '#E31A1C', '#BD0026', '#800026']
style = dict(weight=2, opacity=1, color='white', dashArray='3', fillOpacity=0.7)


app.layout = html.Div([

    html.H2('Agriculture Parcels Dashboard', style={'textAlign': 'center'}),

    dcc.Dropdown(['1', '2', '3','4', '5', '6','7', '8', '9','10', '11', '12'], '1', multi=False, id='my-dropdown'),

    html.Div([

        html.Div([
                html.H4('Parcel # 6', style={'textAlign': 'center','color': 'blue', 'fontSize': 20}),
                dcc.Graph(
                    id='my-graph'),
                      
                      
            html.Div([
                dl.Map(center = [47.3824, 2.9253],
                zoom=10,children=[
                    dl.TileLayer(),
                    dl.GeoJSON(data=geojson_data, zoomToBounds=True, zoomToBoundsOnClick=True, hoverStyle=arrow_function(dict(weight=5, color='#666', dashArray='')), hideout=dict(colorscale=colorscale, classes=classes, style=style, colorProp="density"),options=dict(style=dict(color="green")), id="geojson"),
                    ], style={'width': '1000px', 'height': '800px', 'margin': "auto", "display": "block"}, id="map"),
],className="six columns")
])
])
])


@app.callback(
    Output('my-graph', 'figure'),
    Input('my-dropdown', 'ndvi_avg'))

def update_graph(parcel_foreign_id_x_selected):
    dff = df[df.parcel_foreign_id_x==parcel_foreign_id_x_selected]
    print(dff)
    fig = px.line(data_frame=dff, x='s1product_end_time' , y='ndvi_avg')
    return fig


if __name__ == '__main__':
        app.run_server(port=4090)

Hi @abdullah
You might need to read over the dash callback again to make sure you feel more comfortable with it.

The component property of your Input, inside the callback decorator, must be a property that belongs to the dropdown. In your case, you’re probably looking for the ‘value’, not the ‘ndvi_avg’ - because that’s not a component property.

Inside the callback function, you are filtering the dataframe by the column name parcel_foreign_id_x. Just make sure the column values are strings, because that is the type of your dropdown value. Or inversely, you can have both be integers.

1 Like

Hi @adamschroeder

Thank you for your kind response. I will go through the dash callback documentation again and also try your recommended changes.