Is there any possibility to embed a hover effect that displays an image? I found this this for plotly javascript, however I do not know how to implement this in R.
This isn’t possible, but it’s been requested many times over the years. Best place to track progress is here: https://github.com/plotly/plotly.js/issues/1323
I wrote a blogpost on how to create something similar to the visualization you link to using plotly in R. It boils down to using the R’s htmlwidgets library to inject JavaScript into the plotly output. I hope this helps!
Hi,
i just found your answer and looked at your post. Unfortunately it is not working for me using RStudio. The code compiles and I see the plot but not the hover-images.
Could you maybe elaborate on the Versions you used and a bit on the code, what it is doing?
I am using:
RStudio Version 1.1.463 (Mozilla/5.0 (X11; N; Linux x86_64) AppleWebKit/538.1 (KHTML, like Gecko) RStudio Safari/538.1 Qt/5.4.2)
R version 3.4.4 (2018-03-15)
Platform: x86_64-pc-linux-gnu (64-bit)
Running under: Ubuntu 16.04.5 LTS
ggplot2_3.1.0
htmlwidgets_1.3
tidyverse_1.2.1
It would be great to use your solution but somehow I cannot figure out how to get your example running.
I would be glad to get your help here.
Thanks,
Jenn
Is there a comparable approach in Python? Open to writing custom javascript just unsure of where to start.
I don’t know if it is possible to directly display it as hover,
but I did create an application where on hovering over a datapoint (or rather clicking on it because I found this more convenient) an Image is displayed next to the graph.
I solved this by simply getting the hover/clickdata as an input for a callback that takes that data as an input and updates an html.Img()
Also, would it not be possible to just display the single image in the graph by updating the figure layout and replace the image property with an image? You can get the position of the image from the hoverdata and thereby display it at the correct position as well.
I recently answered a similar SO question with a workaround. For those interested please find it here.
@Snizl would you mind sharing your example?
hi everyone,
I am trying to reproduce this example:
https://www.basjacobs.com/post/showing-images-on-hover-in-plotly-with-r/
I can get it to work nicely with a few images, but I have thousands of points, and it doesn’t work until I remove almost all of my data and classes and even then it doesn’t work for all images. Is this a Java performance issue or what do you think is going on here?
library(tidyverse)
library(plotly)
library(data.table)

g <- ggplot(iris, aes(x = Sepal.Length,
                      y = Petal.Length,
                      color = Species,
                      text = file)) + geom_point()
p <- ggplotly(g, tooltip = "text") %>% partial_bundle()


p %>% htmlwidgets::onRender("
    function(el, x) {
      // when hovering over an element, do something
      el.on('plotly_hover', function(d) {

        // extract tooltip text
        txt = d.points[0].data.text;
        // image is stored locally
        image_location = '../2018-10-28-showing-images-on-hover-in-plotly-with-r_files/' + txt + '.jpg';

        // define image to be shown
        var img = {
          // location of image
          source: image_location,
          // top-left corner
          x: 0,
          y: 1,
          sizex: 0.2,
          sizey: 0.2,
          xref: 'paper',
          yref: 'paper'
        };

        // show image and annotation
        Plotly.relayout(el.id, {
            images: [img]
        });
      })
    }
    ")
Hey so if I understood correctly you’ve been able to get it to work partially? I have not been able to get it to work at all, I even ran Bas Jacob’s entire R markdown script and still, the last figure does not display the images. Any help, even if it it’s just getting it to work partially would be highly appreciated!
Sorry for the late reply, hope this is still helpful:
For the plot
def image_graph(img, x_C=1024, y_C=1024, image_info=[0, 0, 0], ID=''):
    '''
    this graph is supposed to show an image and mark a point on it.
    '''
    #print(image_info)
    X_S=image_info[0]
    Y_S=image_info[1]
    ID=image_info[3]


    #calculate aspect ratio
    aspect_ratio=x_C/y_C
    fig=go.Figure()
    # Add invisible scatter trace.
    # This trace is added to help the autoresize logic work.
    fig.add_trace(
        go.Scatter(
            x=[0, x_C],
            y=[0, y_C],
            mode="markers",
            marker_opacity=0
        )
            )
    #displaying marker for the selected cell
    fig.add_trace(go.Scatter(
        hovertext=ID,
        customdata=[ID],
        name=image_info[4],
        x=[X_S],
        #images start with y0 at the top, graphs with y0 at the bottom
        y=[abs(Y_S-y_C)],
        mode='markers',
        marker_opacity=1,
        marker=dict(color='red')
        ))
    #displaying markers over all other tracked cells
    for i in list(image_info[2]['alt_cells'].keys()):
        fig.add_trace(go.Scatter(
                name=image_info[2]['alt_cells'][i][2],
                hovertext=i,
                customdata=[i],
                x=[image_info[2]['alt_cells'][i][0]],
                y=[abs((image_info[2]['alt_cells'][i][1]-y_C))],
                mode='markers',
                marker_opacity=1,
                marker=dict(color='blue')

                )
        )

    fig.update_layout(
            showlegend=True,
            images=[
                    go.layout.Image(source=img,
                                    xref='x',
                                    yref='y',
                                    x=0,
                                    y=y_C,
                                    #using input image sizes as the
                                    #axes lengths for the graph
                                    sizex=x_C,
                                    sizey=y_C,
                                    sizing='stretch',
                                    opacity=1,
                                    layer='below')],
            #defining height and width of the graph
            height=750,
            width=750*aspect_ratio)

    fig.update_xaxes(visible=False, range=[0, x_C])
    fig.update_yaxes(visible=False, range=[0, y_C])
    fig.update_layout({'clickmode':'event+select'})

    #print('image being displayed')
    return fig
for updating the graph with the images:
It is a bit complicated. Most of the code is about finding the correct image, but the important parts are about the clickdata.
@app.callback(Output('image_dict', 'data'),
              [Input('migration_data', 'clickData')],
              [State('image_list','data'),
               State('identifier_selector', 'value'),
               State('timepoint_selector', 'value'),
               State('unique_time_selector', 'value'),
               State('coordinate_selector', 'value'),
               State('pattern_storage', 'data'),
               State('flag_storage', 'data'),
               State('track_length_selector', 'value')],)
def update_image_overlay(hoverData, image_dict,
                         identifier_selector, timepoint_selector, unique_time_selector,
                         coordinate_selector, pattern_storage, flag_storage, track_length_selector):

    print('pattern storage: ', pattern_storage)
    try:
        pattern=re.compile(pattern_storage[0])
    except TypeError:
        print('Error: no pattern has been submitted')
    #Error message if no images have been uploaded
    if type(image_dict)!= None or len(image_dict)==0:
        print('No images have been uploaded')
    #read data from flag_storage if exists
    if flag_storage != None:
        data=pd.read_csv(flag_storage, index_col='index')
    #else from shared data
    else:
        data=pd.DataFrame(df)
    track_lengths=pd.DataFrame(data.groupby(identifier_selector)[timepoint_selector].count())
    #filtering the track lengths by only selecting those with a track length higher,
    #then the one chosen in the slider
    thresholded_tracks=track_lengths[track_lengths[timepoint_selector]>track_length_selector]
    track_ids=thresholded_tracks.index.tolist()
    data=data.loc[data[identifier_selector].isin(track_ids)]
    #getting hovertext from hoverdata and removing discrepancies between hover text and filenames
    #(stripping of track_ID)
    ID_or=hoverData['points'][0]['hovertext']
    print('ID_or:', ID_or)
    try:
        #getting the different components of the ID. Such as:
        #'WB2' '_S0520' '_E3' '_T40'
        Site_ID, track_ID, Timepoint =re.search(pattern, ID_or).group(
                 'Site_ID', 'TrackID', 'Timepoint')

        #exclusion criterium if timepoint is already there
        exclusion=track_ID+Timepoint
        #print(Timepoint, track_ID, Wellname, Sitename)
        print('exclusion:', exclusion)
        print('track_ID: ', track_ID)
        #getting the ID to the images by stripping off extensions
        #something like 'WB2_S1324
        ID=ID_or.replace(exclusion,'')
        print('ID_or: ', ID_or)
        print('ID: ', ID)
    except AttributeError:
        print('Error: unrecognized pattern')

    #searching the dictionary for keys fitting the hovertext
    try:
        imagelist=[i for i in image_dict.keys() if ID in i]
    except AttributeError:
        print('No images have been uploaded')
    if len(imagelist)==0:
        print('Key Error, no images associated with {} found.'.format(ID))

    #sort images
    imagelist=natsorted(imagelist)
    #getting dimensions of image
    img_size=imageio.imread(image_dict[imagelist[0]]).shape
    #inidiate a dictionary to coordinates for images. Including image shape
    loaded_dict={'shape':img_size,}
    #time_pattern=re.compile('_T+[0-9]*')
    timenumber_pattern=re.compile('[0-9]+')


    #getting part of the data that is from the current image
    #gets the image ID, something like  WB2_S1324_T1
    print('imagelist[0]', imagelist[0])
    Image_ID= imagelist[0]
    print('Image_ID', Image_ID)
    #get the time, something like _T1
    #Time_ID= re.search(time_pattern, Image_ID).group()
    print('Timepoint', Timepoint)
    #get the ID only from the Site, something like WB2_S1324
    #Site_ID= Image_ID.replace(Timepoint, '')
    print('Site_ID', Site_ID)
    #gets part of the dataframe that is from the current image
    Site_data=data[data[identifier_selector].str.contains(Site_ID)]
    #gets the part of the timepoint which is not a number
    timeindicator_pattern=re.compile('.*?(?=[0-9])')
    timeindicator=re.search(timeindicator_pattern, Timepoint).group()

    #getting all the images for the respective timepoints
    for i in imagelist:
        #print(i)
        #adding the unique ID of the cell back into the key of the image
        #to get X, Y coordinates. Something like 'WB2_S1324_E4_T1'
        tracking_ID=i.replace(re.search(timeindicator, i).group(), track_ID+timeindicator)
        #print('tracking_ID: ',tracking_ID)
        img=image_dict[i]
        try:
            x_coord=int(data[data[unique_time_selector]==tracking_ID][coordinate_selector[0]].values)
            y_coord=int(data[data[unique_time_selector]==tracking_ID][coordinate_selector[1]].values)
       #if no data for timepoint is found print error message
        except TypeError:
            print('no segmentation found for', i)
            x_coord=0.1
            y_coord=0.1
        if 'flags' in data.columns:
            flag=data[data[unique_time_selector]==tracking_ID]['flags']
        else:
            flag='None'


        #getting part of the dataframe that is from the current timepoint as well
        #get the time, something like _T1
        #print('i: ', i)
        Time_ID= i.replace(Site_ID, '')
        #print('Time_ID:', Time_ID)
        #gets only the numeric value of the timepoint
        Time= re.search(timenumber_pattern, Time_ID).group()
        #print('Time:', Time)
        timepoint_data=Site_data[Site_data[timepoint_selector]==int(Time)]
        alt_img={}
        for index, row in timepoint_data.iterrows():
            if int(row[coordinate_selector[0]])!=x_coord:
                if 'flags' in data.columns:
                    flag=row['flags']
                else:
                    flag='None'
                alt_img.update({row[unique_time_selector]:[int(row[coordinate_selector[0]]), int(row[coordinate_selector[1]]), flag]})


        loaded_dict.update({img:[x_coord, y_coord, {'alt_cells': alt_img}, tracking_ID, flag]})

    print(AD.take(3, loaded_dict.items()))
    print('encoding complete')
    return loaded_dict
Did you check my answer here? I just updated it with another approach to show local images:
library(base64enc)
library(shiny)
library(shinydashboard)
library(plotly)

ui <- dashboardPage(
  dashboardHeader(title = "Test"),
  dashboardSidebar(),
  dashboardBody(tags$head(tags$style(
    HTML("img.small-img {
          max-width: 75px;
          }")
  )),
  plotlyOutput("hoverplot"))
)

server <- function(input, output, session) {

  # create some local images
  if(!dir.exists("myimages")){
    dir.create("myimages")
  }

  myPlots <- paste0("myimages/myplot", seq_len(3), ".png")

  for (myPlot in myPlots) {
    png(file = myPlot, bg = "transparent")
    plot(runif(10))
    dev.off()
  }

  myImgResources <- vapply(myPlots, function(x){base64enc::dataURI(file = x)}, FUN.VALUE = character(1L))

  dt <- data.frame(
    fruits = c("apple", "banana", "oranges"),
    rank = c(11, 22, 33),
    image_url = myImgResources
  )

  output$hoverplot <- renderPlotly({
    plot_ly(
      dt,
      x         = ~ fruits,
      y         = ~ rank,
      type      = 'scatter',
      mode      = 'markers',
      hoverinfo = 'none',
      source = "hoverplotsource",
      customdata = ~ image_url
    ) %>%
      event_register('plotly_hover') %>%
      event_register('plotly_unhover')
  })

  hover_event <- reactive({
    event_data(event = "plotly_hover", source = "hoverplotsource")
  })

  unhover_event <- reactive({
    event_data(event = "plotly_unhover", source = "hoverplotsource")
  })

  hoverplotlyProxy <- plotlyProxy("hoverplot", session)

  observeEvent(unhover_event(), {
    hoverplotlyProxy %>%
      plotlyProxyInvoke("relayout", list(images = list(NULL)))
  })

  observeEvent(hover_event(), {
    hoverplotlyProxy %>%
      plotlyProxyInvoke("relayout", list(images = list(
        list(
          source = hover_event()$customdata,
          xref = "x",
          yref = "y",
          x = hover_event()$x,
          y = hover_event()$y,
          sizex = 20,
          sizey = 20,
          opacity = 1
        )
      )))
  })
}

shinyApp(ui = ui, server = server)
Hey, is it possible to implement the same which was implemented by bokeh in the umap tutorial, i.e - write python code to plot interactive scatter points - that would print an image of the example when the cursor press/move over it?

Hi, I needed the same, so I wrote a simple function to do it and posted in to this gist: Display dynamically custom HTML on hover / click on a data point of Plotly plot. · GitHub
Example usage (assuming your images are stored locally) :
plot = xp.scatter(df, "nb_x", "nb_y")
template="<img src='./img/{id}.png'>"
interactive_plot(df, plot, template)
Output :

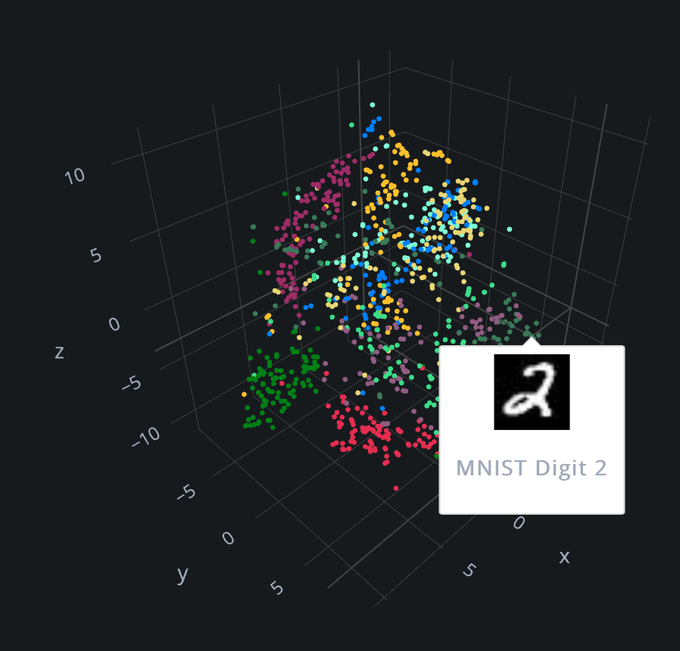
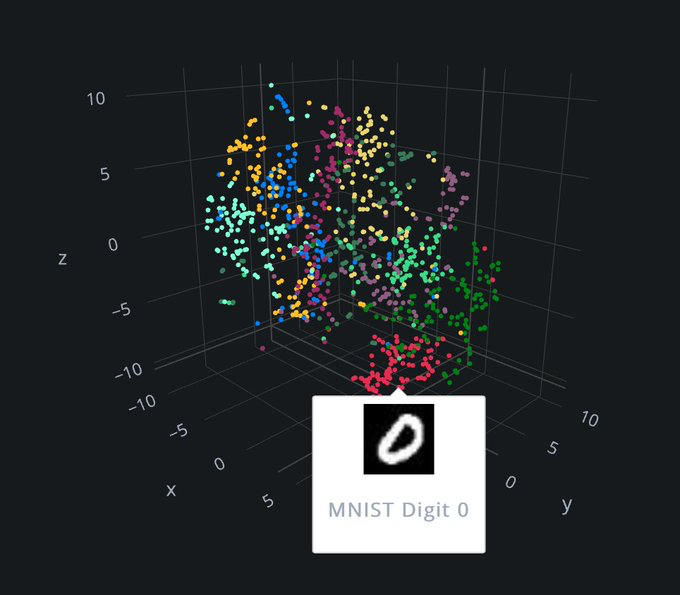
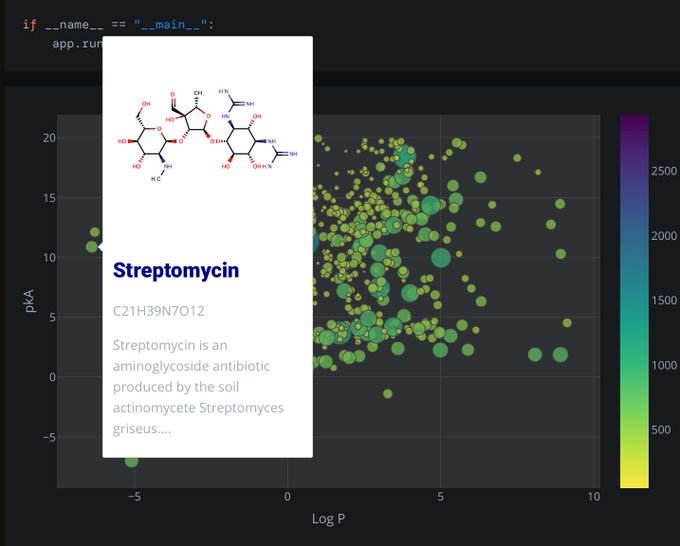
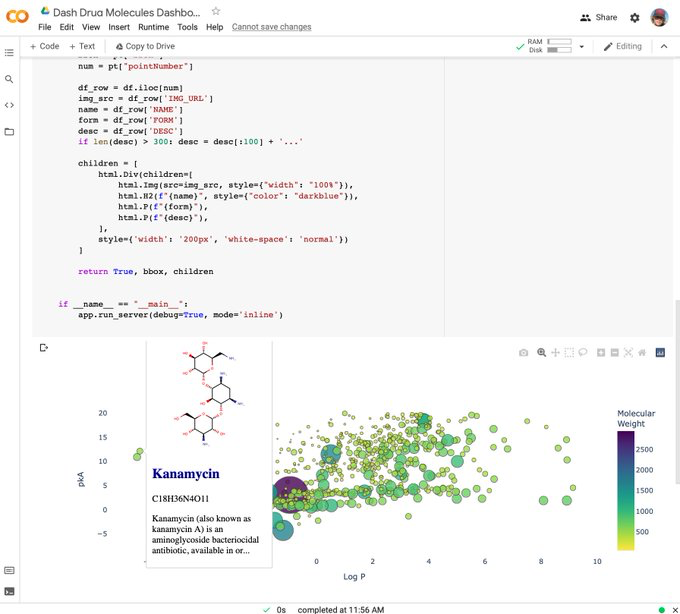
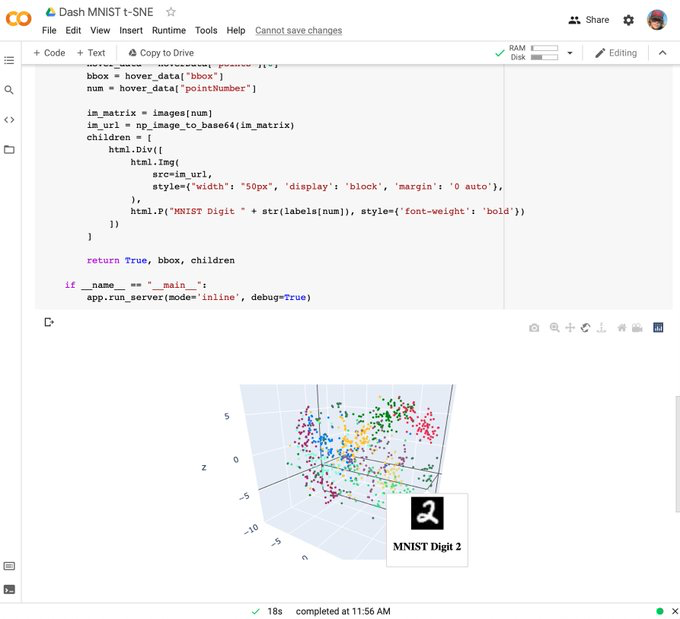
Images on hover is now finally available. Thanks for your patience while we got this right and up to Plotly standards:
 Tooltip | Dash for Python Documentation | Plotly
Screenshots:
If you like this feature, please retweet to help get the word out:https://twitter.com/plotlygraphs/status/1445054301991211023
@jack this looks incredible! Is this only available within Dash? Do you have an example for how to use this with native plotly scatterplots?
