Discontinuity on a 3D Surface plot

Dear all,

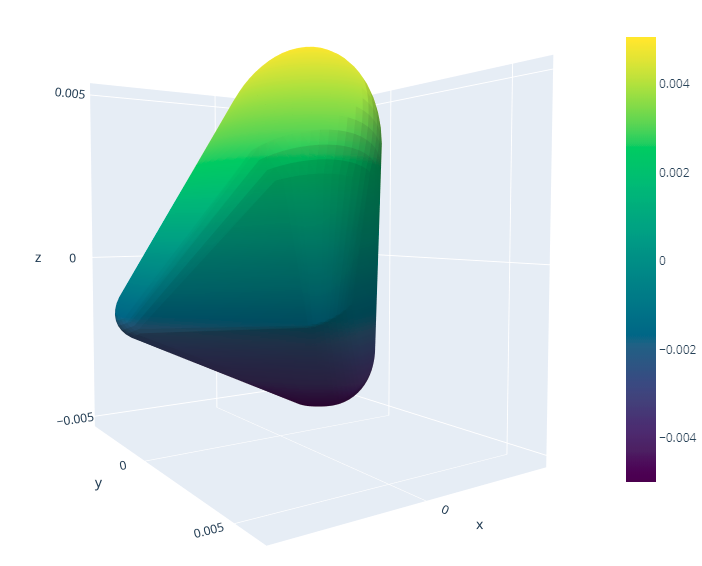
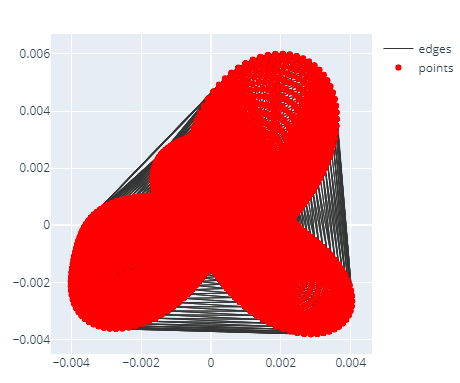
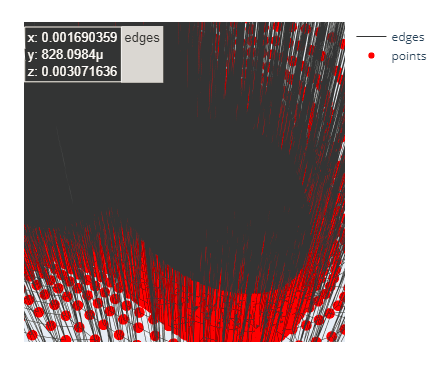
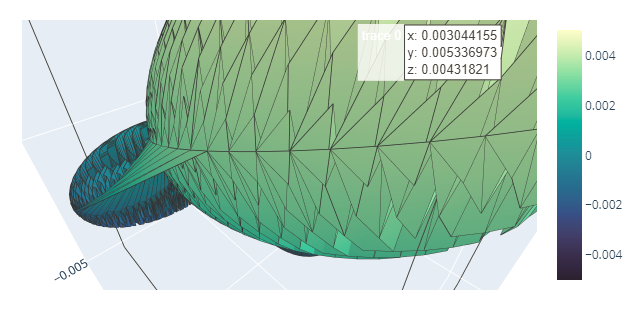
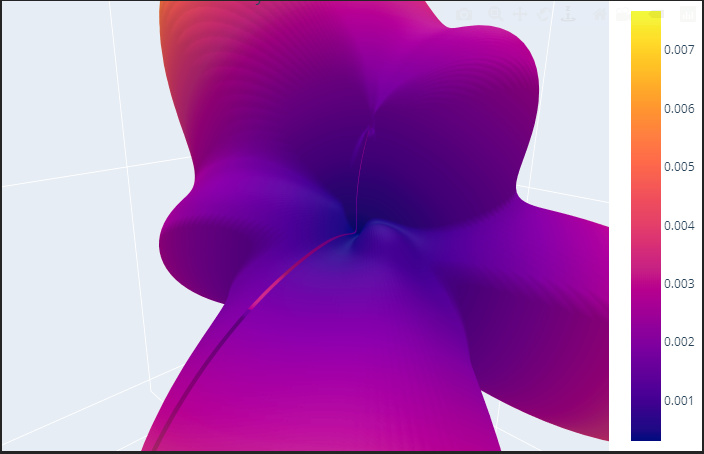
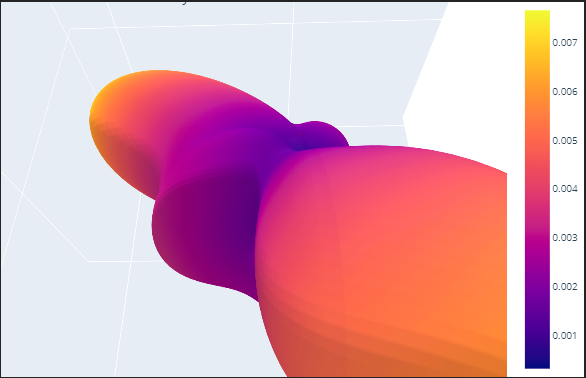
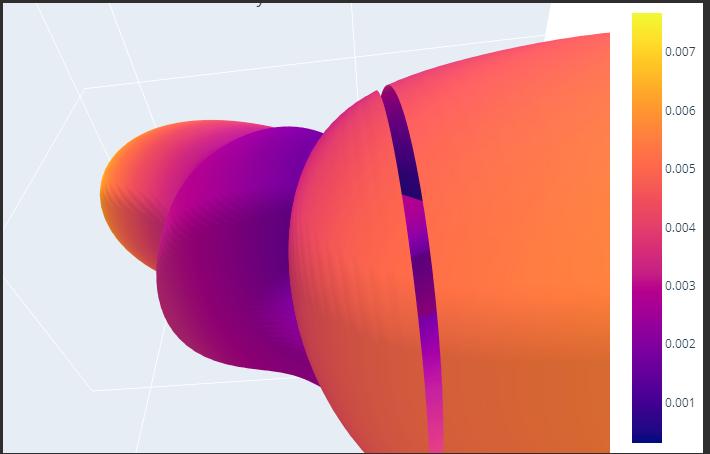
I am plotting data of a 3D distribution both with the scatter and the surface plot. As it is possible to see from the following snippets, I am experiencing a discontinuity using the surface plot although the scattered plot doesn’t show any missing set of data. Is there a parameter/option I am overlooking?

The code I am using is the following:


fig = go.Figure(data=[go.Scatter3d(x=x, y=y, z=z,

                    mode='markers',

                    marker=dict(

                        size=5,

                        color=d,            # set color to an array/list of desired values

                        colorscale='Viridis',   # choose a colorscale

                        opacity=1.,

                        showscale=True          # to show the legend according to the color

                   )

                )])

fig.update_layout(title='TFMeOx MFPADs theory scattered',margin=dict(l=0, r=0, b=0, t=0))

fig.show()

fig = go.Figure(data=[go.Surface(z=Z, x=X, y=Y, surfacecolor=d_matrix)])
fig.update_layout(title='TFMeOx MFPADs theor surfy', autosize=False,
                #   width=500, height=500,
                #   margin=dict(l=65, r=50, b=65, t=90))
                  margin=dict(l=0, r=0, b=0, t=0))
fig.show()

Any suggestion is very welcome!

Hi @giammi56,
To suggest how that discontinuity can be removed I need to know how your data, X, Y, Z are defined.

Hi @empet!

Here the conversion from spherical to cartesian coordinated of a .csv file of 2000 entries x 3 variables (phi, cos(theta), counts (equal to r) ). Then, I reshape all the np arrays to match the requirements of the plotting function. Do you need more info?


x = counts * np.sin(theta_rad) * np.cos(phi_rad)

X = x.reshape(100,200)

y = counts * np.sin(theta_rad) * np.sin(phi_rad)

Y = y.reshape(100,200)

z = counts * ctheta

Z = z.reshape(100,200)

@giammi56

Yes I need the exact data. I’m suspecting that x.reshape, y.reshape, z.reshape is the cause of discontinuity.

I am sorry, but I cannot send you the exact data set. I produced a dummy version of a sphere instead that shows the same problem, I guess!

@giammi56

As I suspected, the discontinuity is caused by array reshape. A surface must be defined either as the graph of a continuous function of two variables, z=f(x,y), or by a parameterization,

x=f(u,v)
y=g(u,v)           (u,v) in [a,b] x [c,d]
z=h(u,v)

In the former case to get x, y, z for a go.Surface instance, one defines:

x = np.linspace(a,b, n)
y =np.linspace(c,d, m)
x, y = np.meshgrid(x,y)
z = f(x,y)

By such a definition x, y, z are arrays of shape (m,n) and the corresponding surface is continuous.

For a parameterized surface a discretization is got as follows:

u = np.linspace(a,b, n)
v =np.linspace(c,d, m)
u, v= np.meshgrid(u, v)
x = f(u,v)
y = g(u,v)
z = h(u,v)

To define a surface from a point cloud (as in your case), first you must triangulate the point cloud, and then plot the corresponding mesh as a Plotly Mesh3d trace.

Tomorrow I’ll post an example of point cloud triangulation and Mesh3d definition.

Thank you @empet for your answer. I am plotting a data set with cartesian coordinates in a point cloud form like in your example. I don’t have a function f(x,y), therefore the parametrization is not possible in my case.

It is impressive how all the points are correctly interpreted, apart from the link between the end and the beginning of the data. Isn’t it possible to “connect”, like in a graph, just those two ends? Couldn’t just be a wrong reshaping or a missing redefinition of the edges? I am trying to avoid the triangulation.

@giammi56

It’s difficult to look at a file of floats to decide how you can make a continuous surface by reshaping 1d array.

If you know the geometry of the surface you could try an interpolating method.

@giammi56

Here https://chart-studio.plotly.com/~empet/15838 is an example of surface reconstruction from a point cloud, using delaunay3d (it is a different method from that reconstructing a surface of equation z=f(x,y)).

@empet I have tried the tringulation suggested in your example with the following results:

Te problem is the edge connection. I have tried your previous example and both the 3D and 2D triangulations go crazy connecting points very far away one from the other AND apparently acrosso che scructure…

2D triangualtion

I have tried directly the 3D version of your code:

points3d_trace = go.Scatter3d(x=x, y=y, mode='markers', marker_color='red', marker_size=6)
point_trace3d= go.Scatter3d(x=x, y=y, 
                         mode='markers',
                         name='points',
                         marker_color='red',
                         marker_size=6)
pts2d = np.array([x,y]).T
tri = Delaunay(pts2d)
delaunay_tritri = triangulation_edges(pts3d, tri.simplices, linewidth=1)
fig4 = go.Figure(data=[delaunay_tritri, point_trace3d])
fig4.update_layout(width=500, height=500);
fig4.show()

NOTE:

pts2d = np.array([x,y]).T
tri = Delaunay(pts2d)

won’t work because the dimension of tri would be 4…
This quick fix doesn’t work, because it connects all points INTERNALL, probably becasue the 2d projection in Delaunay

3D point und edges

In fact the Meash3D results in this interestingsolid:

image

It is possible to notice those thin “wings” that aren’t supposed to be there and instead of a surface mesh it is more a vertical mesch in the volume. Similar case to this one I’d say.

The go.Surface makes a smooth job and I still don’t really understand why it can’t close that stripe…

@giammi56

This odd behaviour is due to the existence of degenerate tetrahedra. The Delaunay triangulation works when the point cloud is in the so called general position, i.e. no four 3d points are coplanar, but it seems that this is the case with your data.

How can I check that? It seems from my go.Scatter3d plot from the first post, that all the 20000 points of the cloud are not degenerate, but of course, if you plot them in 2D roughly half of them will be degenerate.

@giammi56

The method presented here cannot be applied to your point cloud because your surface doesn’t seem to be a graph of a function of two variables( some vertical lines intersect the surface more than once).

Could you describe the geometry of the surface as it appears when you plot only the points? I’m seeing three components. Are they connected into a single surface or are separated?

The points lay all at the surface and describe a continuous surface. You can have an idea of the shape from the Surface plot and the last 2D projection: three long lobes, plus several small ones close to the centre of the distribution. The vertical lines on the graph with edges and points are artefacts: for some reason, the method connects points belonging to different sides, maybe because this method

pts2d = np.array([x,y]).T
tri = Delaunay(pts2d)

is a 2D projection.

I have partially resolved the issue, noticing a very trivial fact: my data set (originally expressed in spherical coordinates) is defined for phi in the range [-179.1,179.1] but for cos(theta) in the range [-0.9998799999999999, 0.9998799999999999]. For the sake of the plot, I forced all ends to be the same, therefore:

#fixing the stripe
Y[-1,0:100]=Y[0,0:100]
X[-1,0:100]=X[0,0:100]
Z[-1,0:100]=Z[0,0:100]

Resulting in the fixed surface:

image

The question still remains: why isn’t go.Surface doing this alone and why the meshing is not working?

Thank you @empet for your precious support.