Hello.
I will attach two images. One from my windows browser and de second one from my tablet screen, both images correspond to the same Django example application.
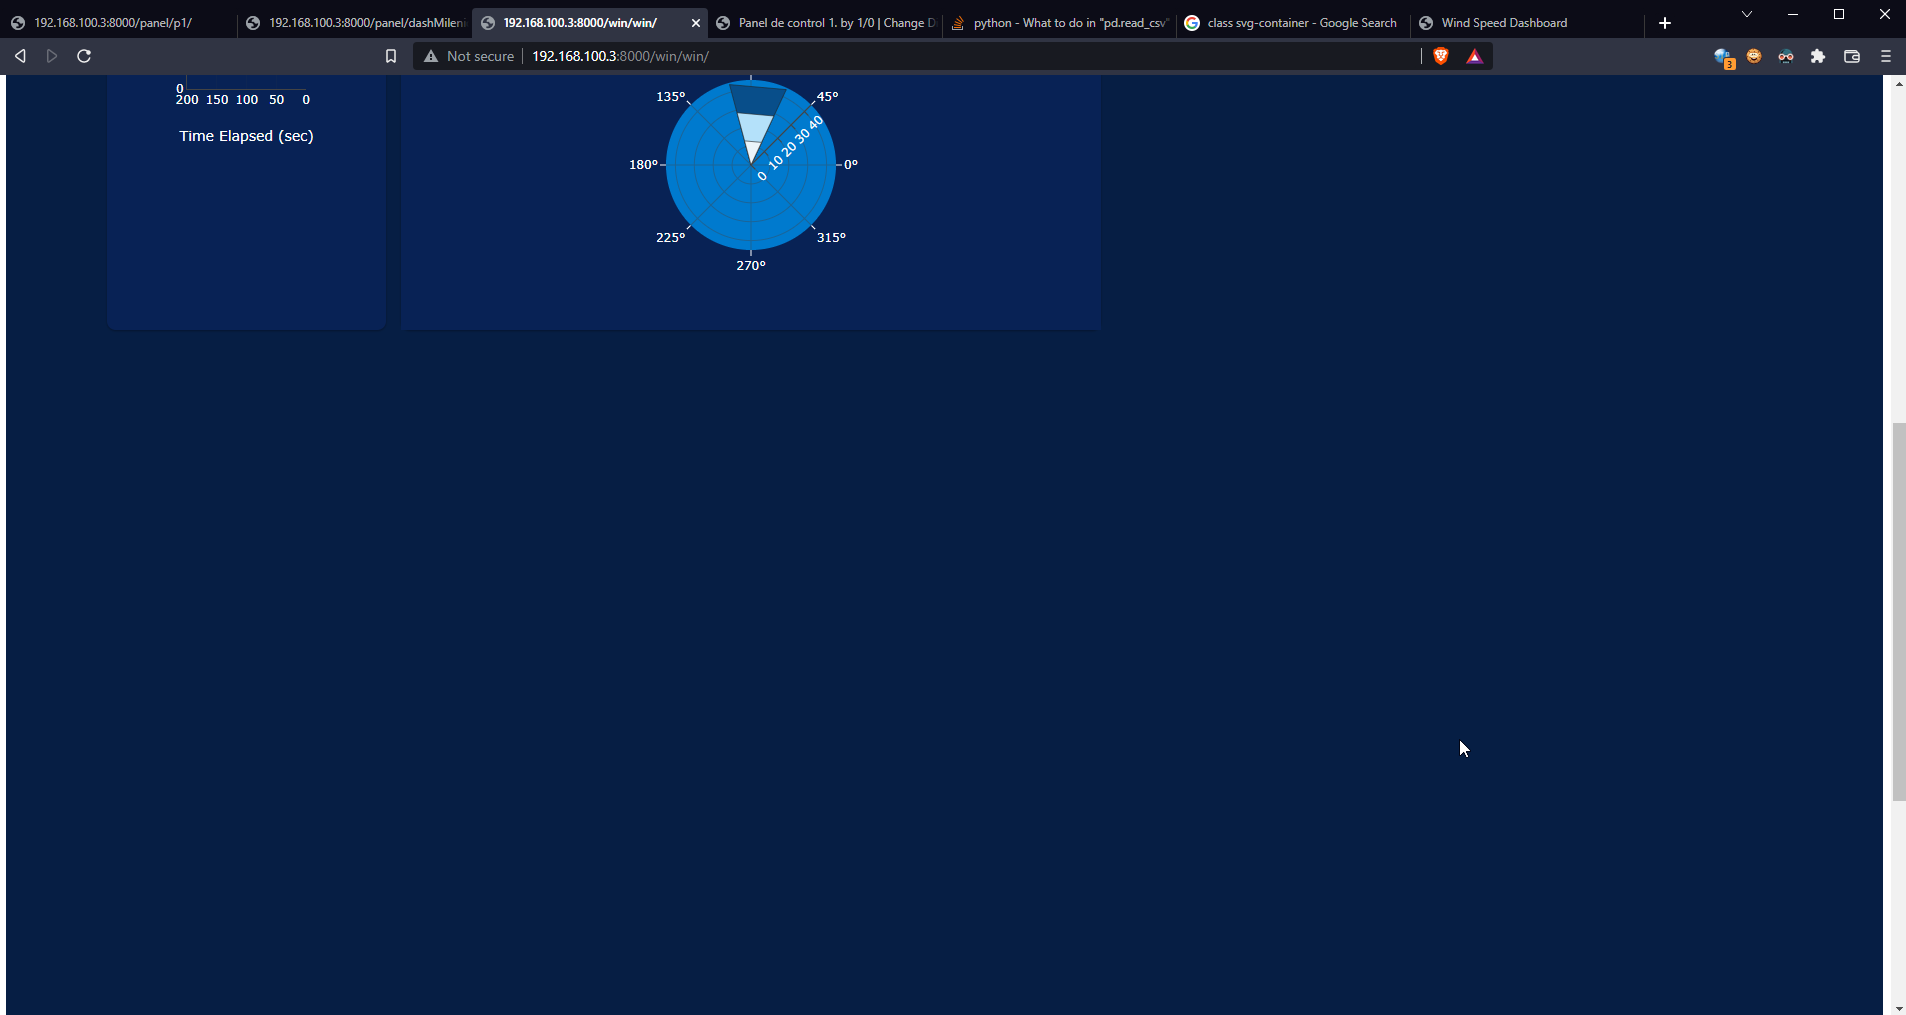
I don’t know why in my table only the half of the screen is used.


Regards
I don’t know, either.
Thanks for your answer.
I’am using django 3.2
Here is my code
import os
import numpy as np
import datetime as dt
from dash import dcc
from dash import html
from dash.exceptions import PreventUpdate
from dash.dependencies import Input, Output, State
from scipy.stats import rayleigh
from .db.api import get_wind_data, get_wind_data_by_id
from django_plotly_dash import DjangoDash
from django.shortcuts import render, redirect, get_object_or_404
GRAPH_INTERVAL = os.environ.get("GRAPH_INTERVAL", 5000)
app = DjangoDash('win') #initialising dash app
app.css.append_css({ "external_url" : "assets/style.css" })
app.title = "Wind Speed Dashboard"
#server = app.server
app_color = {"graph_bg": "#082255", "graph_line": "#007ACE"}
app.layout = html.Div(
[
# header
html.Div(
[
html.Div(
[
html.H4("WIND SPEED STREAMING", className="app__header__title"),
html.P(
"This app continually queries a SQL database and displays live charts of wind speed and wind direction.",
className="app__header__title--grey",
),
],
className="app__header__desc",
),
html.Div(
[
html.A(
html.Button("SOURCE CODE", className="link-button"),
href="https://github.com/plotly/dash-sample-apps/tree/main/apps/dash-wind-streaming",
),
html.A(
html.Button("ENTERPRISE DEMO", className="link-button"),
href="https://plotly.com/get-demo/",
),
html.A(
html.Img(
src=app.get_asset_url("dash-new-logo.png"),
className="app__menu__img",
),
href="https://plotly.com/dash/",
),
],
className="app__header__logo",
),
],
className="app__header",
),
html.Div(
[
# wind speed
html.Div(
[
html.Div(
[html.H6("WIND SPEED (MPH)", className="graph__title")]
),
dcc.Graph(
id="wind-speed",
figure=dict(
layout=dict(
plot_bgcolor=app_color["graph_bg"],
paper_bgcolor=app_color["graph_bg"],
)
),
),
dcc.Interval(
id="wind-speed-update",
interval=int(GRAPH_INTERVAL),
n_intervals=0,
),
],
className="two-thirds column wind__speed__container",
),
html.Div(
[
# histogram
html.Div(
[
html.Div(
[
html.H6(
"WIND SPEED HISTOGRAM",
className="graph__title",
)
]
),
html.Div(
[
dcc.Slider(
id="bin-slider",
min=1,
max=60,
step=1,
value=20,
updatemode="drag",
marks={
20: {"label": "20"},
40: {"label": "40"},
60: {"label": "60"},
},
)
],
className="slider",
),
html.Div(
[
dcc.Checklist(
id="bin-auto",
options=[
{"label": "Auto", "value": "Auto"}
],
value=["Auto"],
inputClassName="auto__checkbox",
labelClassName="auto__label",
),
html.P(
"# of Bins: Auto",
id="bin-size",
className="auto__p",
),
],
className="auto__container",
),
dcc.Graph(
id="wind-histogram",
figure=dict(
layout=dict(
plot_bgcolor=app_color["graph_bg"],
paper_bgcolor=app_color["graph_bg"],
)
),
),
],
className="graph__container first",
),
# wind direction
html.Div(
[
html.Div(
[
html.H6(
"WIND DIRECTION", className="graph__title"
)
]
),
dcc.Graph(
id="wind-direction",
figure=dict(
layout=dict(
plot_bgcolor=app_color["graph_bg"],
paper_bgcolor=app_color["graph_bg"],
)
),
),
],
className="graph__container second",
),
],
className="one-third column histogram__direction",
),
],
className="app__content",
),
],
className="app__container",
)
def get_current_time():
""" Helper function to get the current time in seconds. """
now = dt.datetime.now()
total_time = (now.hour * 3600) + (now.minute * 60) + (now.second)
return total_time
@app.callback(
Output("wind-speed", "figure"), [Input("wind-speed-update", "n_intervals")]
)
def gen_wind_speed(interval):
"""
Generate the wind speed graph.
:params interval: update the graph based on an interval
"""
total_time = get_current_time()
df = get_wind_data(total_time - 200, total_time)
trace = dict(
type="scatter",
y=df["Speed"],
line={"color": "#42C4F7"},
hoverinfo="skip",
error_y={
"type": "data",
"array": df["SpeedError"],
"thickness": 1.5,
"width": 2,
"color": "#B4E8FC",
},
mode="lines",
)
layout = dict(
plot_bgcolor=app_color["graph_bg"],
paper_bgcolor=app_color["graph_bg"],
font={"color": "#fff"},
height=700,
xaxis={
"range": [0, 200],
"showline": True,
"zeroline": False,
"fixedrange": True,
"tickvals": [0, 50, 100, 150, 200],
"ticktext": ["200", "150", "100", "50", "0"],
"title": "Time Elapsed (sec)",
},
yaxis={
"range": [
min(0, min(df["Speed"])),
max(45, max(df["Speed"]) + max(df["SpeedError"])),
],
"showgrid": True,
"showline": True,
"fixedrange": True,
"zeroline": False,
"gridcolor": app_color["graph_line"],
"nticks": max(6, round(df["Speed"].iloc[-1] / 10)),
},
)
return dict(data=[trace], layout=layout)
@app.callback(
Output("wind-direction", "figure"), [Input("wind-speed-update", "n_intervals")]
)
def gen_wind_direction(interval):
"""
Generate the wind direction graph.
:params interval: update the graph based on an interval
"""
total_time = get_current_time()
df = get_wind_data_by_id(total_time)
val = df["Speed"].iloc[-1]
direction = [0, (df["Direction"][0] - 20), (df["Direction"][0] + 20), 0]
traces_scatterpolar = [
{"r": [0, val, val, 0], "fillcolor": "#084E8A"},
{"r": [0, val * 0.65, val * 0.65, 0], "fillcolor": "#B4E1FA"},
{"r": [0, val * 0.3, val * 0.3, 0], "fillcolor": "#EBF5FA"},
]
data = [
dict(
type="scatterpolar",
r=traces["r"],
theta=direction,
mode="lines",
fill="toself",
fillcolor=traces["fillcolor"],
line={"color": "rgba(32, 32, 32, .6)", "width": 1},
)
for traces in traces_scatterpolar
]
layout = dict(
height=350,
plot_bgcolor=app_color["graph_bg"],
paper_bgcolor=app_color["graph_bg"],
font={"color": "#fff"},
autosize=False,
polar={
"bgcolor": app_color["graph_line"],
"radialaxis": {"range": [0, 45], "angle": 45, "dtick": 10},
"angularaxis": {"showline": False, "tickcolor": "white"},
},
showlegend=False,
)
return dict(data=data, layout=layout)
@app.callback(
Output("wind-histogram", "figure"),
[Input("wind-speed-update", "n_intervals")],
[
State("wind-speed", "figure"),
State("bin-slider", "value"),
State("bin-auto", "value"),
],
)
def gen_wind_histogram(interval, wind_speed_figure, slider_value, auto_state):
"""
Genererate wind histogram graph.
:params interval: upadte the graph based on an interval
:params wind_speed_figure: current wind speed graph
:params slider_value: current slider value
:params auto_state: current auto state
"""
wind_val = []
try:
# Check to see whether wind-speed has been plotted yet
if wind_speed_figure is not None:
wind_val = wind_speed_figure["data"][0]["y"]
if "Auto" in auto_state:
bin_val = np.histogram(
wind_val,
bins=range(int(round(min(wind_val))), int(round(max(wind_val)))),
)
else:
bin_val = np.histogram(wind_val, bins=slider_value)
except Exception as error:
raise PreventUpdate
avg_val = float(sum(wind_val)) / len(wind_val)
median_val = np.median(wind_val)
pdf_fitted = rayleigh.pdf(
bin_val[1], loc=(avg_val) * 0.55, scale=(bin_val[1][-1] - bin_val[1][0]) / 3
)
y_val = (pdf_fitted * max(bin_val[0]) * 20,)
y_val_max = max(y_val[0])
bin_val_max = max(bin_val[0])
trace = dict(
type="bar",
x=bin_val[1],
y=bin_val[0],
marker={"color": app_color["graph_line"]},
showlegend=False,
hoverinfo="x+y",
)
traces_scatter = [
{"line_dash": "dash", "line_color": "#2E5266", "name": "Average"},
{"line_dash": "dot", "line_color": "#BD9391", "name": "Median"},
]
scatter_data = [
dict(
type="scatter",
x=[bin_val[int(len(bin_val) / 2)]],
y=[0],
mode="lines",
line={"dash": traces["line_dash"], "color": traces["line_color"]},
marker={"opacity": 0},
visible=True,
name=traces["name"],
)
for traces in traces_scatter
]
trace3 = dict(
type="scatter",
mode="lines",
line={"color": "#42C4F7"},
y=y_val[0],
x=bin_val[1][: len(bin_val[1])],
name="Rayleigh Fit",
)
layout = dict(
height=350,
plot_bgcolor=app_color["graph_bg"],
paper_bgcolor=app_color["graph_bg"],
font={"color": "#fff"},
xaxis={
"title": "Wind Speed (mph)",
"showgrid": False,
"showline": False,
"fixedrange": True,
},
yaxis={
"showgrid": False,
"showline": False,
"zeroline": False,
"title": "Number of Samples",
"fixedrange": True,
},
autosize=True,
bargap=0.01,
bargroupgap=0,
hovermode="closest",
legend={
"orientation": "h",
"yanchor": "bottom",
"xanchor": "center",
"y": 1,
"x": 0.5,
},
shapes=[
{
"xref": "x",
"yref": "y",
"y1": int(max(bin_val_max, y_val_max)) + 0.5,
"y0": 0,
"x0": avg_val,
"x1": avg_val,
"type": "line",
"line": {"dash": "dash", "color": "#2E5266", "width": 5},
},
{
"xref": "x",
"yref": "y",
"y1": int(max(bin_val_max, y_val_max)) + 0.5,
"y0": 0,
"x0": median_val,
"x1": median_val,
"type": "line",
"line": {"dash": "dot", "color": "#BD9391", "width": 5},
},
],
)
return dict(data=[trace, scatter_data[0], scatter_data[1], trace3], layout=layout)
@app.callback(
Output("bin-auto", "value"),
[Input("bin-slider", "value")],
[State("wind-speed", "figure")],
)
def deselect_auto(slider_value, wind_speed_figure):
""" Toggle the auto checkbox. """
# prevent update if graph has no data
if "data" not in wind_speed_figure:
raise PreventUpdate
if not len(wind_speed_figure["data"]):
raise PreventUpdate
if wind_speed_figure is not None and len(wind_speed_figure["data"][0]["y"]) > 5:
return [""]
return ["Auto"]
@app.callback(
Output("bin-size", "children"),
[Input("bin-auto", "value")],
[State("bin-slider", "value")],
)
def show_num_bins(autoValue, slider_value):
""" Display the number of bins. """
if "Auto" in autoValue:
return "# of Bins: Auto"
return "# of Bins: " + str(int(slider_value))
def vWin(request) :
return render(request, 'win/win.html')
This is what the original site (Wind Speed Dashboard) looks like on my tablet and on windows
On the tablet, the box for “the wind speed histogram” appears slightly misaligned which is resolved when I use the tablet horizontally.
The content of the Django template (win.html) which produced the images I attached yesterday is :
{% load plotly_dash %}
{% plotly_app name=“win” ratio=0.7 %}
You may like this below.
https://dash-bootstrap-components.opensource.faculty.ai/docs/components/layout/
You can use lg, md or sm properties to define responsive width. Or classname to specify width, you know, bootstrap divides the page width into 12 columns.
Thanks for your answer stu.
I decided to use this sample code precisely because it doesn’t use dash-bootstrap-components.
This dashboard is an example that you can see here Wind Speed Dashboard
And the code is available here: dash-sample-apps/apps/dash-wind-streaming at main · plotly/dash-sample-apps · GitHub
So I would expect it to work much the same in my implementation. The important difference is the Django framework.
I decided to try to implement my dashboard without using dash-bootstrap-components because in my attempt and after many tests I could not eliminate a double horizontal scrollbar that is unnecessary and confusing for users. I will attach a picture of that problem. According to my tests, that double scrollbar appears as soon as the row and col components are used, but I’m not sure.
I appreciate any suggestion you can give me. In principle, the dashbaord I need is the one in the following image and I decided to try other examples to better understand how plotlydash works and find better solutions for my implementation.
Best regards.