Hi, I am trying to plot a dataframe, and would like some of the columns to be dashed, while the others remain solid. The columns which will be dashed will change over time, so I have a list which tracks which ones need to be dashed. In general, the code I tried was something like this:
cols = [c for c in df.columns if ‘condition’ in c]
fig = px.line(data_frame=df, line_dash=cols)
Currently, cols is a list of only one column. I am receiving the error "All arguments should have the same length. The length of argument ‘line_dash’ is 1, whereas the length of previously-processed arguments [‘index’, ‘column 1’ … etc] is 4.
I’m having trouble figuring out how to fix this - I thought line_dash indicates which data to apply a dash to, but if I have to pass the same length as my columns, that would simply make all of them dashed, no?
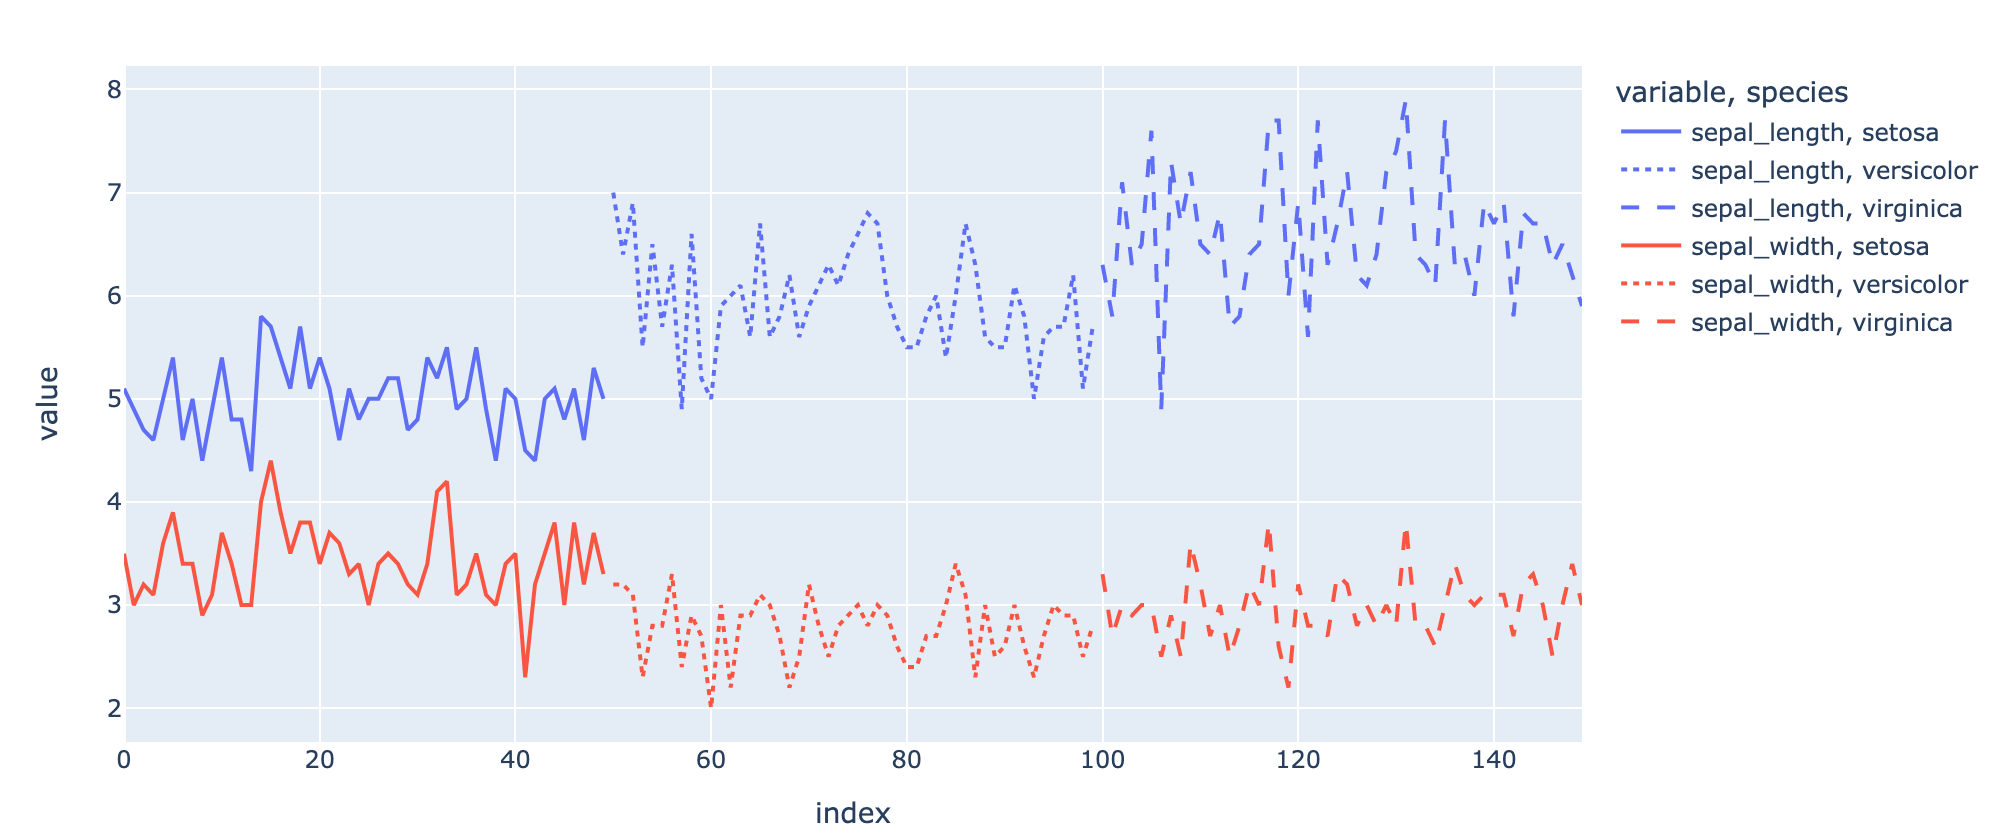
I think line_dash in your case can be a bit confusing, so let me give you two other examples (very similar) that might clarify what is the effect of it.
Note how line_dash is purely related to the rows (points) and not to the columns in the dataset, and it connects points with from the same column and the same line_dash in the order they appeared.
My suggestion would be to manipulate the “data” array explicitly:
for trace in fig["data"]:
    # assuming the name of each plot is the column name (default)
    if trace["name"] in cols_that_should_be_dashed:
         trace["line"]["dash"] = "dashed" # or whatever valid name