Dash does not shows top graph properly only few last shows correctly

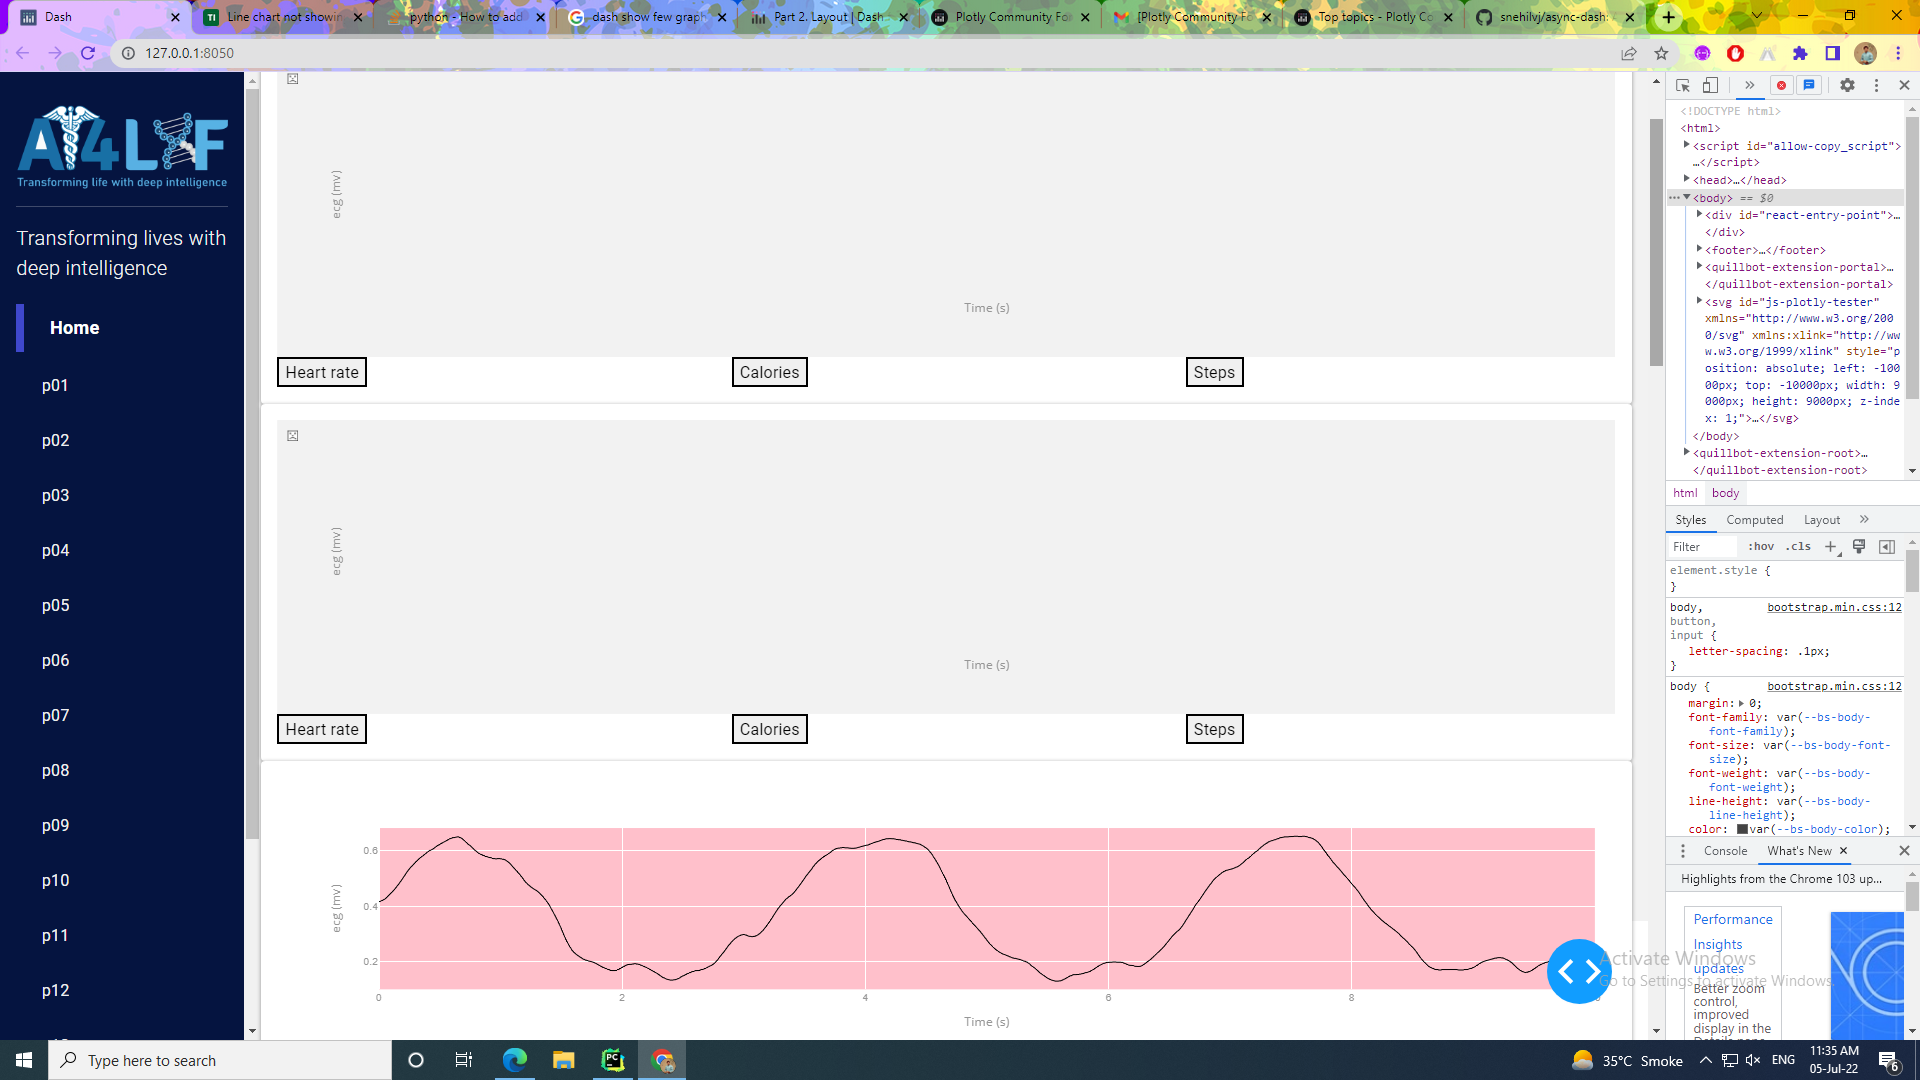
Hi all, I am building a Dash Python app. In which I have 16 users data and show 16 graph on a page. I display other graph and they all look ok. But one specific graph is not shown correctly. it only show last 8 graph correctly and first 8 graph not showing. whenever I resize the window the first graph blink and show line then again disappear.

the plot function code is hear.

def ecg_plot(chunked_ecg, X):
    fig = go.Figure()
    fig = px.line(x=X, y=chunked_ecg)
    fig.update_layout(xaxis=dict(
        showgrid=True,
        showticklabels=True,
        tickfont=dict(
            family='Arial',
            size=10,
            color='rgb(150, 150, 150)',
        ),
    ),
        yaxis=dict(
            zeroline=False,
            showline=False,
            showgrid=True,
            tickfont=dict(
                family='Arial',
                size=10,
                color='rgb(150, 150, 150)',
            ),
        ),
        autosize=True,
        margin=dict(
            autoexpand=True,
            l=100,
            r=20,
            t=50,
        ),
        xaxis_title='Time (s)',
        yaxis_title='ecg (mv)',
        showlegend=False,
        font_color='rgb(150, 150, 150)',
        font_size=10,
        # width=1000, height=300,
        plot_bgcolor='pink')
    fig.update_traces(line=dict(color='black', width=1))
    return fig

i also check it on diffrent browser it same.
my work env is local with python 3.9 and latest dash version.

PS: if I show just first 8 graph it will display fine. as i increase4 then 8 the remaining will disappear.

the browser showing this warning
“WARNING: Too many active WebGL contexts. Oldest context will be lost.”

Hi @Arslan , that error occurs because each chrome tab only gets a limited number of webGL contexts and each plotly gl trace (e.g scattergl) requires two of them. Once you exceed that allocation the browser takes contexts away from existing plots and gives it to newer ones. See Too many active WebGL contexts. Oldest context will be lost · Issue #337 · plotly/plotly.js · GitHub for more details.

As a work around, you can force the charts not to use webGL by adding render_mode='svg' to your call to px.line (this will slow them down if there are a lot of points).

Alternatively you can use a package like dash lazy load to only render the charts as a user scrolls down to them. This way charts at the bottom of the page won’t take contexts away from the ones at the top until they need to.

3 Likes