@chriddyp Is it possible currently to display multi index tables or pandas pivot tables with dash-table-experiments. I could not get it to work.
If not, what do you think is the best alternative to display multi-index tables. Thanks!
2 Likes
@ashutoshshahi - There is no built-in way to do this (yet). You will need to format the rows of your multi-index table manually.
Note that the rows attribute of the dash_table_experiments.DataTable component looks something like this:
dt.DataTable(
    rows=df.to_dict('records')
)
which looks something like this:
>>>  df = pd.DataFrame({'x': [1, 2, 3], 'y': [3, 1, 4]})
>>> df.to_dict('records')
[{'x': 1, 'y': 3}, {'x': 2, 'y': 1}, {'x': 3, 'y': 4}]
So, in a multi-index table you may want to format your rows to look something like:
[
    {'index-1': 'A', 'index-2': 1, 'column-1': 1},
    {'index-1': '', 'index-2': 2, 'column-1': 5},
    {'index-1': '', 'index-2': 3, 'column-1': -4},
    ...
    {'index-1': 'B', 'index-2': 1, 'column-1': 5},
    {'index-1': '', 'index-2': 2, 'column-1': 2},
    {'index-1': '', 'index-2': 3, 'column-1': -5},
    ...
]
The underlying react component that we are using for rendering tables does have a grouping feature which could be useful in this case: http://adazzle.github.io/react-data-grid/examples.html#/grouping. This isn’t supported yet and it will require a bit of work to get right.
If you or your company need this feature, please reach out: https://plot.ly/products/consulting-and-oem/
Thanks for the tip! I’ll give your suggestion a go and see if it suffices what we need
Is this now built into dash? If not:
- When can we expect it to be available?
- Is your proposed workaround still the best way to do this in dash?
I would love to have that feature as well, has there been any progress?
1 Like
Also interested in this feature. Any update?
2 Likes
HI Chris,
Thanks for this, I tried to use the structure you specified but it doesn’t give me what i want/expected. Instead of the row collapsing to one I simply have rows where an index is missing. eg. in your example ‘A’ takes up three rows, and so I expected the datatable to merge three rows and give them the value A at that column ‘index-1’, instead I just have ‘A’ in the first row, then empty fields in the next two…
Is there any workaround for this or is it just not possible? Thanks in advance
Is there any development on this, can we include multi header dataframes directly in our Dash Tables?
Any updates on this? I would still find this feature rather helpful even taking into the different workarounds!
1 Like
A lot could be learned from html syntax in pandas.DataFrame.to_html. I’ll demonstrate a few approaches. Database that I use is:
import pandas as pd
from dash import html

d = {'Full':
    {'Lithuania':
         {'Aukštaitija': ('Panevėžys',	'6.3°C'),
          'Žemaitija': ('Telšiai', '5.9°C'),
          'Dzūkija': ('Alytus', '6.4°C'),
          'Suvalkija': ('Marijampolė', 'No data'),
          'Mažoji Lietuva': ('Tilžė', '8.2°C')},
     'Latvia':
         {'Kurzeme': ('Jelgava', '7.1°C'),
          'Zemgale': ('Jelgava', '7.1°C'),
          'Vidūmō': ('Riga', '6.1°C'),
          'Latgale': ('Daugavpils', '5.5°C')}
    },
    'Short':
    {'Lithuania':
         {'Aukštaitija': ('Panevėžys',	'6.3°C'),
          'Žemaitija': ('Telšiai', '5.9°C'),
          'Dzūkija': ('Alytus', '6.4°C'),
          'Suvalkija': ('Marijampolė', 'No data')},
     'Latvia':
         {'Kurzeme & Zemgale': ('Jelgava', '7.1°C'),
          'Vidūmō': ('Riga', '6.1°C'),
          'Latgale': ('Daugavpils', '5.5°C')}
    },
    }

df = pd.concat([pd.concat([pd.DataFrame(d2).T for d2 in d1.values()],
                                keys=d1.keys()) for d1 in d.values()],
                     keys=d.keys())

df.index.set_names(['Portion', 'Country', 'Cultural Region'], inplace=True)
df.columns = ['Capital', 'Average Temperature']
Using html.Iframe + df.to_html
This is quite a simple way. Although, I don’t really a design that pandas use to distinguish between multiindex names and column names:
html.Iframe(width="800", height="500", sandbox='', srcDoc=df.to_html())
And here it goes:

Creating html from scratch
You could rewrite a script of df.html in Dash & customize your style, this is my MWE that uses a smaller database:
table_style = {'border': '3px solid'}
header_section_style = {'border': '2px solid'}
body_section_style = {'border': '2px solid'}
body_index_cell_style = {'text-align': 'left',
                    'border':'1px solid',
                    'backgroundColor': 'rgb(210, 210, 255)',
                    'valign':'top',
                    'font-weight': 'bold'}
body_column_cell_style = {'text-align': 'right',
                     'border':'1px solid grey',
                     'backgroundColor': 'rgb(210, 255, 210)'}
header_index_cell_style = {'text-align': 'left',
                    'border':'2px solid',
                    'backgroundColor': 'rgb(165, 165, 255)',
                    'valign':'top',
                    'font-weight': 'bold'}
header_column_cell_style = {'text-align': 'right',
                     'border':'2px solid',
                     'backgroundColor': 'rgb(165, 255, 165)',
                     'font-weight': 'bold'}

# CREATE TABLE MANUALLY (thanks to pd.to_html)
table = html.Table([
            html.Thead([
                html.Tr([
                    html.Th('Country', style=header_index_cell_style),
                    html.Th('Cultural Region', style=header_index_cell_style),
                    html.Th('Capital', style=header_column_cell_style),
                    html.Th('Avg. temperature', style=header_column_cell_style)
                ])
            ], style=header_section_style),
            html.Tbody([
                html.Tr([
                    html.Td('Lithuania', rowSpan=5, style=body_index_cell_style),
                    html.Td('Aukštaitija', style=body_index_cell_style),
                    html.Td('Panevėžys', style=body_column_cell_style),
                    html.Td('6.3°C', style=body_column_cell_style)
                    ]),
                html.Tr([
                    html.Td('Žemaitija', style=body_index_cell_style),
                    html.Td('Telšiai', style=body_column_cell_style),
                    html.Td('5.9°C', style=body_column_cell_style)
                    ]),
                html.Tr([
                    html.Td('Dzūkija', style=body_index_cell_style),
                    html.Td('Alytus', style=body_column_cell_style),
                    html.Td('6.4°C', style=body_column_cell_style)
                ]),
                html.Tr([
                    html.Td('Suvalkija', style=body_index_cell_style),
                    html.Td('Marijampolė', style=body_column_cell_style),
                    html.Td('No data', style=body_column_cell_style)
                ]),
                html.Tr([
                    html.Td('Mažoji Lietuva', style=body_index_cell_style),
                    html.Td('Tilžė', style=body_column_cell_style),
                    html.Td('8.2°C', style=body_column_cell_style)
                ]),
                html.Tr([
                    html.Td('Latvia', rowSpan=4, style=body_index_cell_style),
                    html.Td('Kurzeme', style=body_index_cell_style),
                    html.Td('Jelgava', style=body_column_cell_style),
                    html.Td('7.1°C', style=body_column_cell_style)
                ]),
                html.Tr([
                    html.Td('Zemgale', style=body_index_cell_style),
                    html.Td('Jelgava', style=body_column_cell_style),
                    html.Td('7.1°C', style=body_column_cell_style)
                ]),
                html.Tr([
                    html.Td('Vidūmō', style=body_index_cell_style),
                    html.Td('Riga', style=body_column_cell_style),
                    html.Td('6.1°C', style=body_column_cell_style)
                ]),
                html.Tr([
                    html.Td('Latgale', style=body_index_cell_style),
                    html.Td('Daugavpils', style=body_column_cell_style),
                    html.Td('5.5°C', style=body_column_cell_style)
                ])
            ], style=body_section_style)
        ], style=table_style)

Automating a process of html creation
I know it seems a nightmare to build it from schratch so you could feel free to use a method that does this job for you:
#in addition to import pandas as pd & from dash import html:
import numpy as np

def multiindex_table(df):
    # storing rowSpan values for every cell of index;
    # if rowSpan==0, html item is not going to be included
    pos = np.diff(df.index.codes, axis=1, prepend=-1)
    for row in pos:
        counts = np.diff(np.flatnonzero(np.r_[row, 1]))
        row[row.astype(bool)] = counts

    # filling up header of table;
    column_names = df.columns.values
    headTrs = html.Tr([html.Th(n, style=header_index_cell_style) for n in df.index.names] +
                      [html.Th(n, style=header_column_cell_style) for n in column_names])
    # filling up rows of table;
    bodyTrs = []
    for rowSpanVals, idx, col in zip(pos.T, df.index.tolist(), df.to_numpy()):
        rowTds = []
        for name, rowSpan in zip(idx, rowSpanVals):
            if rowSpan != 0:
                rowTds.append(html.Td(name, rowSpan=rowSpan, style=body_index_cell_style))
        for name in col:
            rowTds.append(html.Td(name, style=body_column_cell_style))
        bodyTrs.append(html.Tr(rowTds))

    table = html.Table([
        html.Thead(headTrs, style=header_section_style),
        html.Tbody(bodyTrs, style=body_section_style)
    ], style=table_style)
    return table
It should work if you run this demo:
import dash
app = dash.Dash(__name__)
app.layout = multiindex_table(df)
if __name__ == '__main__':
    app.run_server(debug=True)

3 Likes
Beautiful examples @loijord , thanks for sharing!
hi there,
Yes you can pass multi-index data frames into a DashTable.
You have to transform the columns in your multi index pandas dataframe before passing them into a dash_table with:
cols = df.columns
df.columns = ["_".join(i) for i in cols]
The following workaround worked for me in this case:
- Lets say you have a multi-index data frame with 2 column indexes, then this should work:
from dash import dash_table

df.columns = df.columns.set_levels([df.columns.levels[0].astype(str), df.columns.levels[1].astype(str)])
cols = df.columns

table = dash_table.DataTable (
    id='table',
    columns=[{'name': list(i), "id": "_".join(i)} for i in cols],
    data=df.to_dict(orient='records'),
)
2 Likes
Another great recipe, thanks for sharing @Silvio !
Thanks Chris! Glad i could help! =D
1 Like
Is there a way this table convert into a bootstrap table o give it that style?
dash has no support for it currently. html.Iframe is able to convert html script which is given within df.to_html(). You could only modify this html script to create a dbc.Table-like style like in my answer. It’s unlikely that dash core components supports straight conversion. Try to look more into documentation of dbc.Table.
I do something like Silvio’s technique, only I keep having to do it over and over (and reusing the data in various places.) So my solution was a small function to take in the dataframe and spit out the data and columns as appropriate.
def datatable_settings_multiindex(df, flatten_char = '_'):
    ''' Plotly dash datatables do not natively handle multiindex dataframes.
    This function generates a flattend column name list for the dataframe,
    while structuring the columns to maintain their original multi-level format.

    Function returns the variables datatable_col_list, datatable_data for the columns and data parameters of
    the dash_table.DataTable'''
    datatable_col_list = []

    levels = df.columns.nlevels
    if levels == 1:
        for i in df.columns:
            datatable_col_list.append({"name": i, "id": i})
    else:
        columns_list = []
        for i in df.columns:
            col_id = flatten_char.join(i)
            datatable_col_list.append({"name": i, "id": col_id})
            columns_list.append(col_id)
        df.columns = columns_list

    datatable_data = df.to_dict('records')

    return datatable_col_list, datatable_data
Code for the datatable then looks something like this:
df_columns, df_data = datatable_settings_multiindex(df)

dash_table.DataTable(
                                id=datatable_id,
                                columns=df_columns,
                                data=df_data,
                                merge_duplicate_headers=True
)
Probably not. However, you can work with Pandas styles to give your dataframe a more appealing appearance. That is, instead of df.to_html() use df.style.format(...).to_html().
Hi Silvio,
I am still confused, I tried the method but didn’t yield much
import pandas as pd
from dash import Dash, dash_table, html
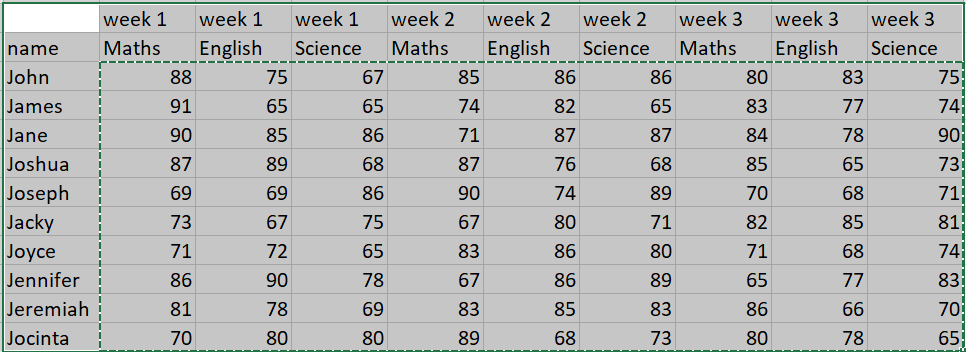
df = pd.read_csv('tables.csv')
df.columns = df.columns.set_levels([df.columns.levels[0].astype(str), df.columns.levels[1].astype(str)])
cols = df.columns
app = Dash(__name__)
# app.layout = html.Div([
table = dash_table.DataTable (
id='table',
columns=[{'name': list(i), "id": "_".join(i)} for i in cols],
data=df.to_dict(orient='records'),
),
# ])
if __name__ == '__main__':
app.run_server(debug=True)