Let me preface with the fact that i am new and self taught!
I am trying to build a real time pressure monitor in Dash and I’ve been having issues with subplots.
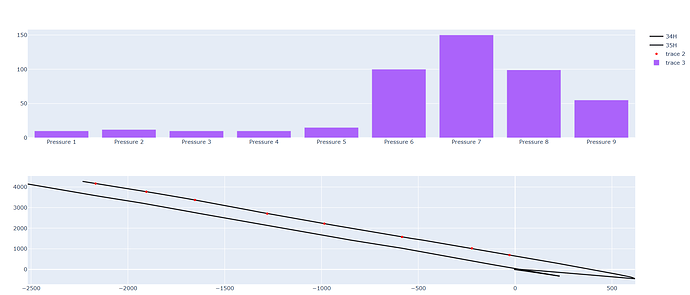
When i run the code by itself it works just fine and i get both subplots, but when i run it from the app callback all i get is a blank Cartesian plot
here is the code for the app callback
@app.callback(dash.dependencies.Output('wellbore-view', 'figure'),
              [dash.dependencies.Input('auto_update', 'n_intervals')])

def auto_update_wellbore(n):
    df = pd.read_csv('test dd.csv', encoding="ISO-8859-1")
    df_live = pd.read_csv('gague data live test.csv', encoding='ISO-8859-1')
    df_gh = pd.read_csv('gague data.csv', encoding="ISO-8859-1")
    delta_p = deque(maxlen=9)
    delta_p.append(df_live['Pressure 1'].iloc[-1])
    delta_p.append(df_live['Pressure 2'].iloc[-1])
    delta_p.append(df_live['Pressure 3'].iloc[-1])
    delta_p.append(df_live['Pressure 4'].iloc[-1])
    delta_p.append(df_live['Pressure 5'].iloc[-1])
    delta_p.append(df_live['Pressure 6'].iloc[-1])
    delta_p.append(df_live['Pressure 7'].iloc[-1])
    delta_p.append(df_live['Pressure 8'].iloc[-1])
    delta_p.append(df_live['Pressure 9'].iloc[-1])


    wellbore_view = make_subplots(rows=2, cols=1)

    well1 = go.Scatter(
        x=df['EW1'],
        y=df['NS1'],
        mode='lines',
        name='34H',
        line=dict(
            color='black'
        )
    )

    well2 = go.Scatter(
        x=df['EW2'],
        y=df['NS2'],
        mode='lines',
        name='35H',
        visible=True,
        line=dict(
            color='black'
        )
    )

    gauges = go.Scatter(
        x=df_gh['EW'],
        y=df_gh['NS'],
        mode='markers',
        marker=dict(
            color='Red',
            size=5,
        ),
    )

    bars = go.Bar(
        x=['Pressure 1', 'Pressure 2', 'Pressure 3', 'Pressure 4', 'Pressure 5', 'Pressure 6', 'Pressure 7',
           'Pressure 8', 'Pressure 9'],
        y=list(delta_p)
    )
    wellbore_view.append_trace(well1, 2, 1)
    wellbore_view.append_trace(well2, 2, 1)
    wellbore_view.append_trace(gauges, 2, 1)
    wellbore_view.append_trace(bars, 1, 1)

    wellbore_traces = [wellbore_view]

    return {
        'data':wellbore_traces
    }
this is what i get when i run it outside of app callback
then when i run inside the app callback
Any and all help is greatly appreciated!

