Dash AgGrid Double Click Event to Change Dataset and Background

Dear all,

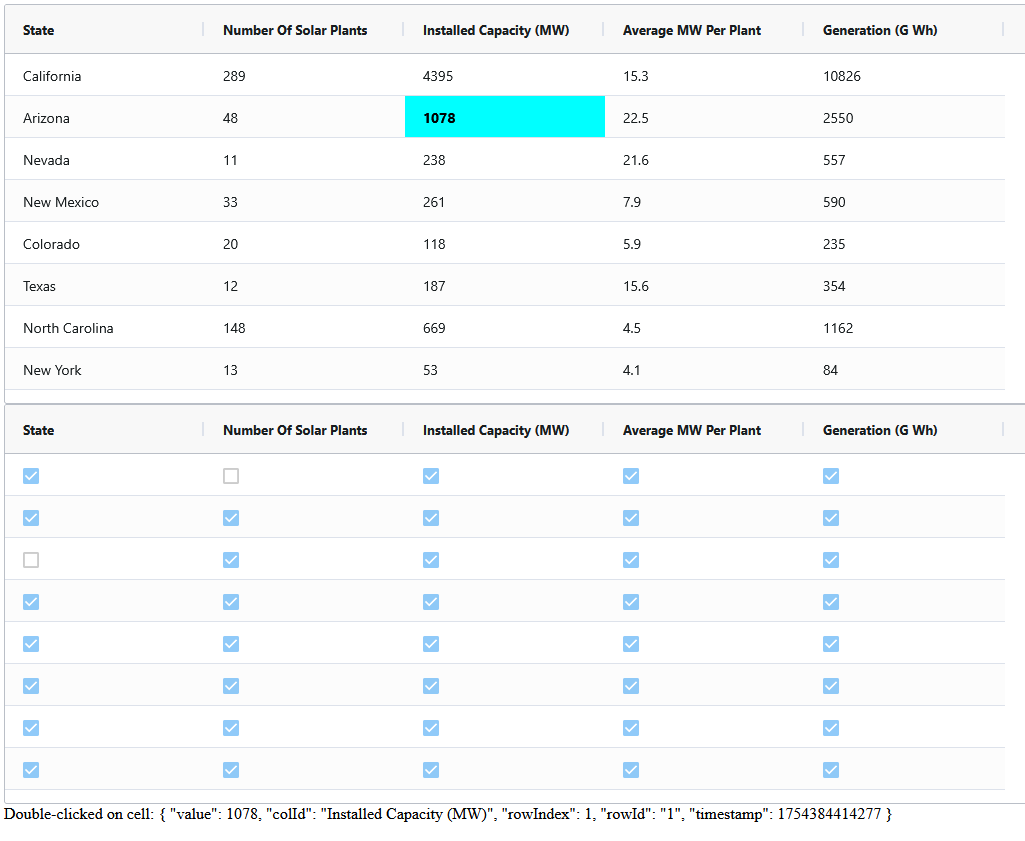
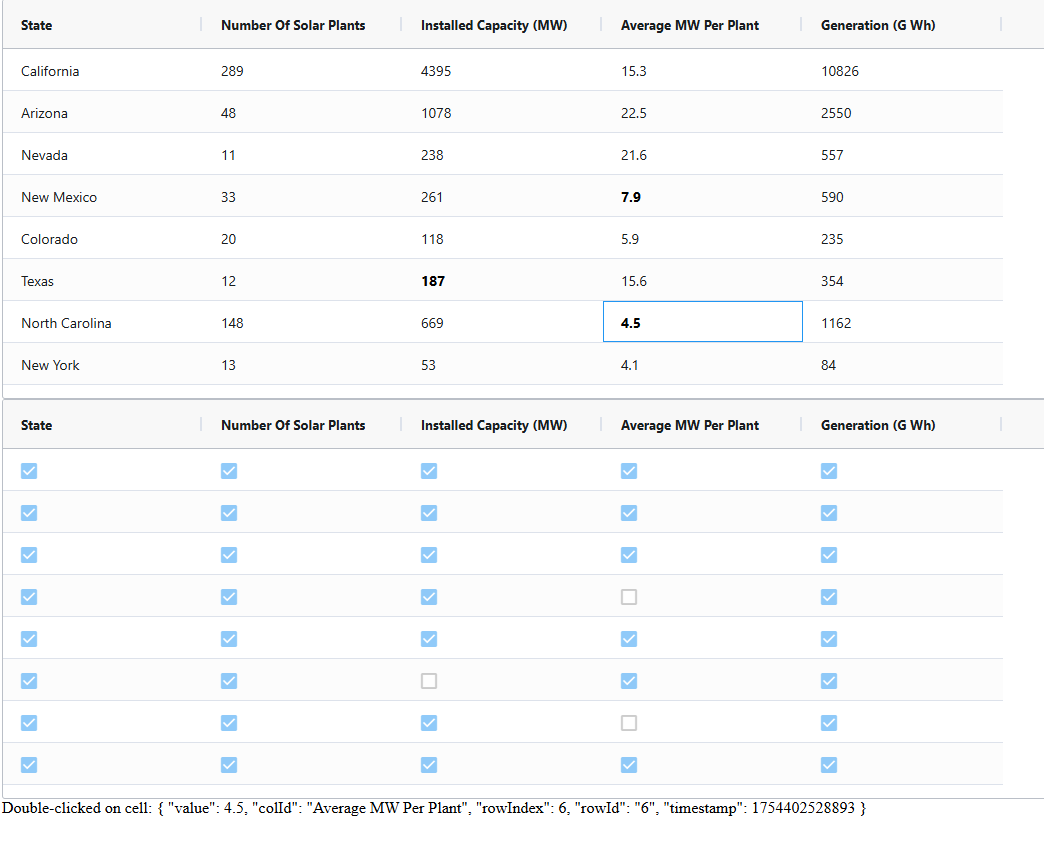
I would like to have a double click event on a cell of a Dash AgGrid (grid-data in the example) to trigger two events:

  • a change in a mask matrix (grid-flag in the example) => this mask matrix will then be used to perform some calculations
  • the updated mask matrix will then be used to color the background of the first dataframe (grid-data depending whether grid-flag is True or False).

I managed to do the first part but I don’t find a way to apply a cell style depending on True/False from another dataframe (the shape/index/columns will be exactly the same). (I tried both callback and clientside_callback withtout success…)

I made a simplified example of the source code I have.

import dash
from dash import Dash, html, dcc, Input, Output, State, callback, clientside_callback, page_container
import dash_ag_grid as dag
import pandas as pd
import json

import os

try:
    parent_dir = os.path.dirname(os.path.abspath(__file__))
    data_absolute_path = os.path.join(parent_dir, "data", "solar.csv")
except:
    df = pd.read_csv('https://raw.githubusercontent.com/plotly/datasets/master/solar.csv')

app = Dash(__name__, title="Test Dash AgGrid")


df_data = pd.read_csv(data_absolute_path, decimal=".", sep=",", index_col=0)

df_flag = df_data.copy()
df_flag[df_flag > 0] = True

grid_data = dag.AgGrid(
    id="grid-data",
    rowData=df_data.to_dict("records"),
    columnDefs=[{"field": i} for i in df_data.columns],
)

grid_flag = dag.AgGrid(
    id="grid-flag",
    rowData=df_flag.to_dict("records"),
    columnDefs=[{"field": i} for i in df_flag.columns],
)

app.layout = html.Div(
    children=[
        grid_data,
        grid_flag,
        html.A(id="grid-text"),
        ],
)

@callback(
    Output("grid-text", "children"),
    Output("grid-flag", "rowData"),
    Input("grid-data", "cellDoubleClicked"),
)
def display_cell_double_clicked_on(cell):
    if cell:
        row = cell['rowIndex']
        col = cell['colId']
        df_flag.at[df_flag.index[row], col] = not df_flag.at[df_flag.index[row], col]
        message = f"Double-clicked on cell:\n{json.dumps(cell, indent=2)}"
    else:
        message = "Double-click on a cell"
    return message, df_flag.to_dict("records")

if __name__ == '__main__':
    app.run(debug=True)

Thank you!

Hello @MTAM,

Welcome to the community, this is possible. Instead of using two dataframes, I used just one and passed a “flag” column to wont be visible:

import dash
from dash import Dash, html, dcc, Input, Output, State, callback, clientside_callback, page_container
import dash_ag_grid as dag
import pandas as pd
import json

import os

df_data = pd.read_csv('https://raw.githubusercontent.com/plotly/datasets/master/solar.csv', decimal=".", sep=",")

app = Dash(__name__, title="Test Dash AgGrid")

df_data['index'] = df_data.index
df_data.reset_index(drop=True, inplace=True)
df_data['flag'] = [{} for _ in range(len(df_data))]

grid_data = dag.AgGrid(
    id="grid-data",
    rowData=df_data.to_dict("records"),
    getRowId="params.data.index",
    columnDefs=[{"field": i, "hide": i in ["flag", "index"],
                 "cellClassRules": {"dbl": "params.data.flag[params.column.colId]"}} for i in df_data.columns],
)

app.layout = html.Div(
    children=[
        grid_data,
        html.A("Double-click on a cell",
               id="grid-text"),
        ],
)

@callback(
    Output("grid-text", "children"),
    Output("grid-data", "rowTransaction"),
    Input("grid-data", "cellDoubleClicked"),
    State("grid-data", "rowData"),
    prevent_initial_call=True
)
def display_cell_double_clicked_on(cell, data):
    updating = {}
    if cell:
        new_data = data[int(cell['rowId'])]
        new_data['flag'][cell['colId']] = not new_data['flag'].get(cell['colId'], False)
        message = f"Double-clicked on cell:\n{json.dumps(cell, indent=2)}"
        updating['update'] = [new_data]
    return message, updating

if __name__ == '__main__':
    app.run(debug=True)

Let me know if this helps you or not, I had a small css file to make the font different when its been double-clicked:

.dbl {
    color: #000;
    font-weight: bold;
}
2 Likes

Hello @jinnyzor ,

Thank you for your welcome and your answer!

I would still prefer to have it in two different datasets because I have multiple treatments on the second dataframe. Do you think there is a way to have them separated?

Cheers

If you have the same id between the two, yes you can have them be separate.

Just perform the updates similar to how I am doing it and use cellClassRules

Hi again,

I tried to combine your solution and a second dataframe in the above code. However, I have some - random? - issues where several cells are triggered for the seconde dataframe instead of one from time to time. Would you have any idea how to fix it please?

In the screen above, I only clicked once on the blue cell and got the 3 cells disabled.

import dash
from dash import Dash, html, dcc, Input, Output, State, callback, clientside_callback, page_container
import dash_ag_grid as dag
import pandas as pd
import json

import os

df_data = pd.read_csv('https://raw.githubusercontent.com/plotly/datasets/master/solar.csv', decimal=".", sep=",")

app = Dash(__name__, title="Test Dash AgGrid")

df_flag = df_data.copy()
df_flag[:] = True

df_data['index'] = df_data.index
df_data.reset_index(drop=True, inplace=True)
df_data['flag'] = [{} for _ in range(len(df_data))]

grid_data = dag.AgGrid(
    id="grid-data",
    rowData=df_data.to_dict("records"),
    getRowId="params.data.index",
    columnDefs=[{"field": i, "hide": i in ["flag", "index"],
                 "cellClassRules": {"dbl": "params.data.flag[params.column.colId]"}} for i in df_data.columns],
)

grid_flag = dag.AgGrid(
    id="grid-flag",
    rowData=df_flag.to_dict("records"),
    columnDefs=[{"field": i} for i in df_flag.columns],
)

app.layout = html.Div(
    children=[
        grid_data,
        grid_flag,
        html.A("Double-click on a cell",
               id="grid-text"),
        ],
)

@callback(
    Output("grid-text", "children"),
    Output("grid-data", "rowTransaction"),
    Output("grid-flag", "rowData"),
    Input("grid-data", "cellDoubleClicked"),
    State("grid-data", "rowData"),
    prevent_initial_call=True
)
def display_cell_double_clicked_on(cell, data):
    updating = {}
    if cell:
        row = cell['rowIndex']
        col = cell['colId']
        new_data = data[int(cell['rowId'])]
        new_data['flag'][cell['colId']] = not new_data['flag'].get(cell['colId'], False)
        df_flag.at[df_flag.index[row], col] = not df_flag.at[df_flag.index[row], col]
        message = f"Double-clicked on cell:\n{json.dumps(cell, indent=2)}"
        updating['update'] = [new_data]
    return message, updating, df_flag.to_dict("records")

if __name__ == '__main__':
    app.run(debug=True, port=8051)

Thanks !

It works for me, what version of DAG are you running?

It actually works most of times except the first time randomly… That’s really weird…

I’m using dash_ag_grid==32.3.0.

What version of Dash?

Dash v3.1.1

Can you have the processing be clientside, or does it have to be on the server?

The visual on the grid (the bold / blue background) can be clientside but I’m using this matrix of boolean for some calculation on the server side.

Try this with a chained callback:

import dash
from dash import Dash, html, dcc, Input, Output, State, callback, clientside_callback, page_container
import dash_ag_grid as dag
import pandas as pd
import json

import os

df_data = pd.read_csv('https://raw.githubusercontent.com/plotly/datasets/master/solar.csv', decimal=".", sep=",")

app = Dash(__name__, title="Test Dash AgGrid")

df_flag = df_data.copy()
df_flag[:] = True

default_flag = {col: True for col in df_data.columns}

df_data['index'] = df_data.index
df_data.reset_index(drop=True, inplace=True)
df_data['flag'] = [default_flag for _ in range(len(df_data))]

grid_data = dag.AgGrid(
    id="grid-data",
    rowData=df_data.to_dict("records"),
    getRowId="params.data.index",
    columnDefs=[{"field": i, "hide": i in ["flag", "index"],
                 "cellClassRules": {"dbl": "!params.data.flag[params.column.colId]"}} for i in df_data.columns],
)

grid_flag = dag.AgGrid(
    id="grid-flag",
    rowData=df_flag.to_dict("records"),
    columnDefs=[{"field": i} for i in df_flag.columns],
)

app.layout = html.Div(
    children=[
        grid_data,
        grid_flag,
        html.A("Double-click on a cell",
               id="grid-text"),
        ],
)

# Clientside callback (in assets or inline)
app.clientside_callback(
    """
    function(newData, oldData) {
        if (!newData || !oldData) { return window.dash_clientside.no_update; }
        let updated = oldData.map((row, i) => {
            let updatedRow = {...row};
            if (newData[i]) {
                updatedRow.flag = newData[i];
            }
            return updatedRow;
        });
        return {'update': updated};
    }
    """,
    Output("grid-data", "rowTransaction"),
    Input("grid-flag", "rowData"),
    State("grid-data", "rowData"),
    prevent_initial_call=True
)

# Serverside callback
@callback(
    Output("grid-text", "children"),
    Output("grid-flag", "rowData"),
    Input("grid-data", "cellDoubleClicked"),
    State("grid-flag", "rowData"),
    prevent_initial_call=True
)
def display_cell_double_clicked_on(cell, flag_data):
    if cell:
        row = cell['rowIndex']
        col = cell['colId']
        flag_data[row][col] = not flag_data[row][col]
        message = f"Double-clicked on cell:\n{json.dumps(cell, indent=2)}"
        return message, flag_data
    return dash.no_update, dash.no_update

if __name__ == '__main__':
    app.run(debug=True, port=8051)

This needs to be exactly the same order for the rowData, as long as they are the same, it should work. Notice that I inversed the criteria to make it easier to use the rowData from the flag grid.

2 Likes

Perfect! Thanks a lot for your help!