Hello @clevercolt,
There is no children attribute of AG grid, please checkout here:
There are a couple ways to update the data in AG Grid in a Dash callback:
rowData
- this will replace all the data in the table (like the data
prop in the Dash DataTable.)rowTransaction
- this will update only specified data and is a more efficient way to make small updates to larger datasets. See an example in Clientside data section of the docs.Below is a minimal example of switching between two data sets where both the rows and the columns are different, so both rowData
and columnDefs
need to be updated.
from dash import Dash, html, Output, Input, dcc
import plotly.express as px
import dash_ag_grid as dag
app = Dash(__name__)
df_tips = px.data.tips()
df_gapminder = px.data.gapminder()
dropdown = dcc.Dropdown(
id="dataset",
options=["tips", "gapminder"],
value="tips",
clearable=False,
style={"marginBottom": 20, "maxWidth": 200},
)
app.layout = html.Div([html.Div("Select Dataset"), dropdown, dag.AgGrid(id="grid")])
@app.callback(
Output("grid", "rowData"),
Output("grid", "columnDefs"),
Input("dataset", "value"),
)
def set_dataset(v):
dff = df_tips if v == "tips" else df_gapminder
rowData = dff.to_dict("records")
columnDefs = [{"field": i, "id": i} for i in dff.columns]
return rowData, columnDefs
if __name__ == "__main__":
app.run_server(debug=True, port=1234)
Progress is continuing on Open Source Dash AG Grid. 2.0.0a5 was released - no breaking changes in a5 - just lots of new features. We plan to do (at least?) one more release before the full 2.0.0 is ready. The next release will likely have only one small breaking change with one prop, so it shouldn’t be hard to upgrade if you start from the current 2.0.0a5. If you are starting from earlier versions, see the new Migration Guide in the docs.
There are new examples in nearly every section of the docs - here are just some of the highlights:
See these examples --and more! – in the Cell Renderer Componets docs.
Dash Mantine Components Button with icons from DashIconify
Dash Bootstrap Component Buttons with Font Awesome and Bootstrap Icons
Render figures in a dcc.Graph
component
Image Component with a callback to display the full sized image in a dbc.Modal
Stock Portfolio Demo App with Dash Mantine Component Buttons, DashIconify Icons, dcc.Graph component in the grid
Dash Bootstrap Components dbc.Progress
component gallery
Custom Loading and No Rows Overlay
Custom Tooltip
Custom datepicker component
Editing/cell editing Docs
Conditional dropdowns
See this example in the Editing/cell editing Docs
Note the different city dropdown options based on the country
thanks @AnnMarieW . This is super useful.
Also want to mention that, the “manual grouping” feature of JavaScript Data Grid: Row Grouping is also available from the latest release.
Thanks!
Hi @entropy_l
I don’t know what you mean about input values in the header and triggering a calculation - can you post that as a new topic and elaborate?
I’ve been focusing on documenting the free AG Grid Community features first. Pivot is available, but it’s in AG Grid Enterprise.
Here’s the first Pivot example from the AG Grid docs to get you started. If you translate any of the other examples from the AG Grid docs please post them, and I’ll include them in the docs.
import dash_ag_grid as dag
import dash
from dash import html, dcc
import pandas as pd
app = dash.Dash(__name__)
df = pd.read_csv(
"https://raw.githubusercontent.com/plotly/datasets/master/ag-grid/olympic-winners.csv"
)
columnDefs = [
{"field": "country", "rowGroup": True, "enableRowGroup": True},
{"field": "sport", "pivot": True},
{"field": "year"},
{"field": "date"},
{"field": "gold", "aggFunc": "sum"},
{"field": "silver", "aggFunc": "sum"},
{"field": "bronze", "aggFunc": "sum"},
]
defaultColDef = {
"flex": 1,
"minWidth": 150,
"sortable": True,
"resizable": True,
}
app.layout = html.Div(
[
dcc.Markdown("Demonstration of pivot in a Dash AG Grid."),
dcc.Markdown(
"The example below shows a simple pivot on the Sport column using the Gold, Silver and Bronze columns for values."
),
dag.AgGrid(
columnDefs=columnDefs,
rowData=df.to_dict("records"),
dashGridOptions={
"autoGroupColumnDef": {"minWidth": 250},
"pivotMode": True,
},
defaultColDef=defaultColDef,
# Pivot groupings is an ag-grid Enterprise feature.
# A license key should be provided if it is used.
# License keys can be passed to the `licenseKey` argument of dag.AgGrid
enableEnterpriseModules=True,
licenseKey="LICENSE_KEY_HERE",
),
]
)
if __name__ == "__main__":
app.run_server(debug=True)
Thank you!
@AnnMarieW
a. You’re developing some serious marketing chops
b. The question is rapidly becoming not “What can I do w Dash Ag-Grid?” but “What **CAN’**T I do w Dash Ag-Grid?”
Genuinely excited to see how Dash AG Grid is developing!
@AnnMarieW I may have some ideas that might help with automatically converting examples into the Dash format directly from the AG Grid typescript examples. Let me know if your interested!
I may have some ideas that might help with automatically converting examples into the Dash format directly from the AG Grid typescript examples. Let me know if your interested!
Oh, yes!! I’m interested!
And Welcome to the community
Super! I am not sure if you already know but bar a few examples all of the framework variations are generated automatically.
Thinking it might be possible to create a dash transformer and run that over all the examples. Even if not 100% would potentially do a lot of the heavy lifting for you.
That would be great! If you PM me, we can work out the details. Thanks so much for the offer.
Amazing! Anyone know if there is a way to have a column of checkboxes which represents a Boolean value yet?
I would PM but not sure how to on this forum
Maybe you could PM me. Sorry if I am missing something obvious!
I’m pleased to announce that we’ve completed all planned breaking changes, and we’re now doing the final review before the full 2.0.0 release!
If you have tried previous Alpha releases, please see our Migration Guide. to upgrade to the current release.
If you haven’t tried dash-ag-grid
, now’s the time! Beat the crowds and take it for a spin today
Check out the new features available in this release!
If you are on alpha release 4 or 5, the only breaking change in rc1 is a name change for one prop option. Instead of columnSize=autoSizeAll
, use columnSize=autoSize
. This is to accommodate some cool new options for setting the columnSize:
See more info in the Column Size docs
We upgraded to the latest AG Grid release 29.3.2 which has several new features, including sticky column group labels.
See this example in the Column Groups docs.
You can now align two or more grids. If a user changes things like column order or width, the grids stay in sync.
See two examples in the Aligned Grids docs The second examples shows a more typical use-case where one grid has summary data.
Just in case you missed this example, you can also pin one or more rows either on the top or bottom of the grid. This is another way to get a summary row in the grid.
See examples in the Row Pinning docs.
You can use the grid’s default pagination, or provide your own component to control the grid’s pagination.
See an example of how to use the dash-bootstrap-components
dbc.Pagination
buttons to navigate to pages in the grid in the Pagination docs.
This is a new custom component example we added to this release. The NumberInput
component is a great way to ensure that only numeric data is entered into an editable grid cell. Note also that we use valueFormatter
to format the number as currency with two decimal places and thousands separator.
See this example in the Cell Editor Components docs
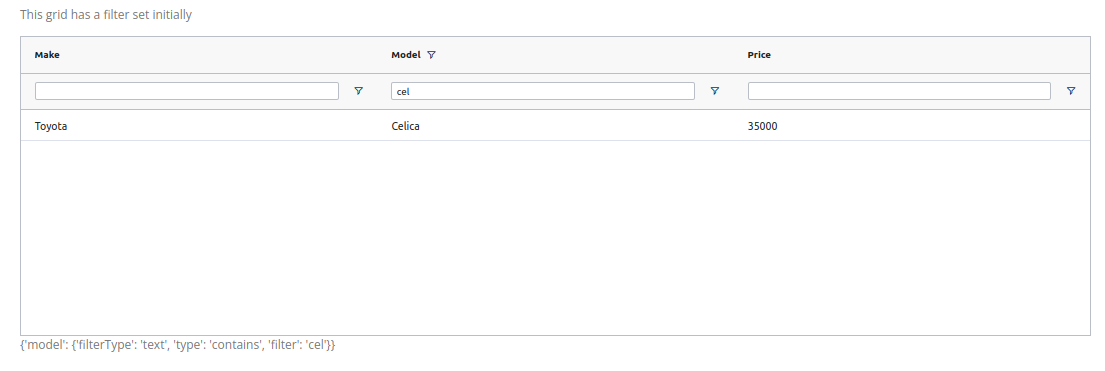
The AG Grid Filter Model is now available. Use this to set a filter for the grid. You can also access to the filters that users set in a Dash callback.
See this example in the Filter Callbacks docs
Here is a new example for AG Grid Enterprise customers. Note that many Enterprise features are available in dash-ag-grid
, but haven’t been documented yet. To get you started, this is the first example of the Pivot feature from the AG Grid docs.
See this in the Enterprise section of the docs.
Dash Ag Grid keeps getting better and better.
To reiterate Ann Marie’s point, the more feedback we get from all of you, the better we can make this feature, especially if you find a bug
Try it our and let us know what you think.
Really enjoying seeing this develop, looks great! Especially keen on the custom JS functions and cell renderers. I’d be really keen to make a custom cell editor that uses dash_core_components Dropdown. Will custom cell editors be possible in the same way as cell renderers?
Hello @alistair.welch,
Welcome to the community!
Yes, cell editors are available as functions. These are not components that need to be imported into dashAgGridComponentFunctions
, but functions that need to me imported into dashAgGridFunctions
.
Check out here:
Thanks so much, I’d only looked at the first few examples on that page, now I see it, brilliant stuff!