Dash AG Grid v2.0.0 released

We’re excited to announce that Dash AG Grid 2.0.0 has been released :rocket:

pip install dash-ag-grid==2.0.0

Dash AG Grid has many great features right out of the box - many of which are customizable.

:pray: Thank you to @jinnyzor and @AnnMarieW for leading the development efforts.

Here are just a few examples of the flexibility behind Dash AG Grid, written by @AnnMarieW. See the docs for more information and even more examples.

Quickstart

from dash import Dash, html, Input, Output
import dash_ag_grid as dag
import pandas as pd

df = pd.read_csv("https://raw.githubusercontent.com/plotly/datasets/master/solar.csv")

app = Dash(__name__)

grid = dag.AgGrid(
    id="quickstart-grid",
    rowData=df.to_dict("records"),
    columnDefs=[{"field": i} for i in df.columns],
    defaultColDef={"resizable": True, "sortable": True, "filter": True, "minWidth":125},
    columnSize="sizeToFit",
)

app.layout = html.Div([grid, html.Div(id="quickstart-output")])


@app.callback(
    Output("quickstart-output", "children"), Input("quickstart-grid", "cellClicked")
)
def display_cell_clicked_on(cell):
    if cell is None:
        return "Click on a cell"
    return f"clicked on cell value:  {cell['value']}, column: {cell['colId']}, row index: {cell['rowIndex']}"


if __name__ == "__main__":
    app.run_server(debug=True)

quickstart

Column size

See more info in the Column Size docs
ag_grid_size2_rc1

Sticky header labels

See this example in the Column Groups docs.
ag_grid_sticky_label

Date and Number Formatting

Dash AG Grid includes the d3-format and d3-time-format libraries - making it easy to format numbers and dates.


See more examples in the Value Formatters with d3-format section of the docs.

Selectable Rows

Here’s a simple JavaScript function that determines whether a row is selectable. (Only rows having a year earlier than 2007 are selectable.)

dag.AgGrid(   
    dashGridOptions = {'isRowSelectable': {"function": "params.data ? params.data.year < 2007 : false" }},
    # other props
)

See the full example in the Selection Checkbox section of Dash AG Grid docs.

Column Spanning

By using a function to set the column width of certain rows, you can make reports that look like this:

See complete example in the docs in the Column Spanning section. This works with Row Spanning too!

Cell Class Rules and Row Class Rules

You can now use class names with condition formatting. In this example, we use Bootstrap class names – so the background colors of the highlighted cells will match your selected Bootstrap theme.

See this example in the Cell Styling section. You can learn how to use class names with conditional formatting to set Row Styles too.

Date Filters

We have Included examples in the docs of how to make the date filters to work “out-of-the-box” using d3.time-format to convert string dates into date objects.

aggrid_date_filter

See more examples in the Filtering section of the docs.

Cell Renderer Components Examples

See these examples --and more! – in the Cell Renderer Componets docs.

Dash Mantine Components Button with icons from DashIconify


Dash Bootstrap Component Buttons with Font Awesome and Bootstrap Icons

ag_grid_dbc_buttons


Render figures in a dcc.Graph component

ag_grid_dccGraph


Image Component with a callback to display the full sized image in a dbc.Modal

ag_grid_jwt


Custom Tooltip

Custom Tooltiop

ag_grid_tooltip


Custom datepicker component

Editing/cell editing Docs

ag_grid_datepicker


Conditional dropdowns

See this example in the Editing/cell editing Docs
Note the different city dropdown options based on the country
ag_grid_conditional_dropdown


Aligned Grids

You can now align two or more grids. If a user changes things like column order or width, the grids stay in sync.

See two examples in the Aligned Grids docs. The second examples shows a more typical use-case where one grid has summary data.

ag_grid_aligned_rc1

Pinned rows

Just in case you missed this example, you can also pin one or more rows either on the top or bottom of the grid. This is another way to get a summary row in the grid.

See examples in the Row Pinning docs.

Custom Pagination

You can use the grid’s default pagination, or provide your own component to control the grid’s pagination.

See an example of how to use the dash-bootstrap-components dbc.Pagination buttons to navigate to pages in the grid in the Pagination docs.

Custom Number Input Component

This is a new custom component example we added to this release. The NumberInput component is a great way to ensure that only numeric data is entered into an editable grid cell. Note also that we use valueFormatter to format the number as currency with two decimal places and thousands separator.

See this example in the Cell Editor Components docs
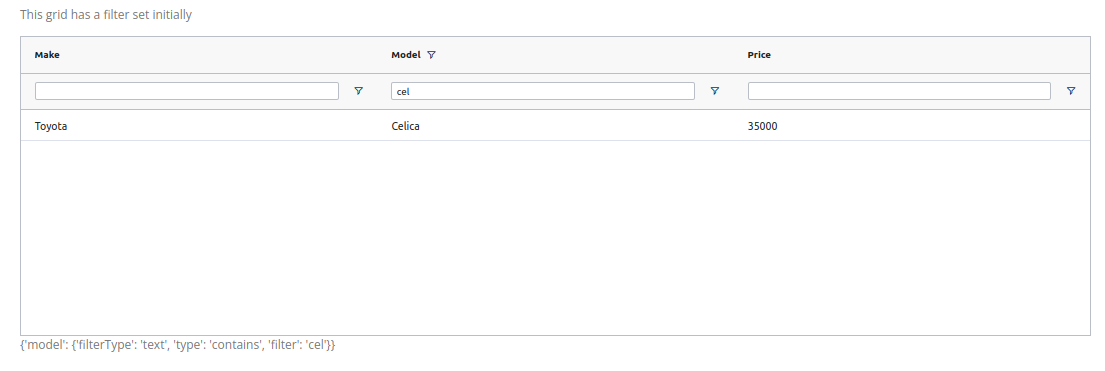
ag_grid_number_input_rc1

Filter Model

The AG Grid Filter Model is now available. Use this to set a filter for the grid. You can also access to the filters that users set in a Dash callback.

See this example in the Filter Callbacks docs

Aggregation with Custom Functions (AG Grid Enterprise)

See complete example in the Enterprise Examples

Pivot example (AG Grid Enterprise only)

Here is a new example for AG Grid Enterprise customers. Note that many Enterprise features are available in dash-ag-grid, but haven’t been documented yet. To get you started, this is the first example of the Pivot feature from the AG Grid docs.

See this in the Enterprise section of the docs.

18 Likes

Sweeeeeet! Bravissimo.

2 Likes

Amazing work! Just a really minor nitpick about the docs at https://dashaggrid.pythonanywhere.com/. Can the section titles be hyperlink-able? Like in the column sizing page, I’d like to link directly to the “Auto-Size Columns” section but must settle for the entire page instead. The granularity would help my code’s documentation be a little more specific and targeted.

Other than that, my AG Grid in its default state already is so much simpler to use than my previous DataTable (and it looks, sorts, and filters better). Plus I had to create a custom function for row highlighting in a DataTable; very happy that AG Grid does that by default!

3 Likes

Hi @the.oldest.house
Glad you like Dash Ag Grid and have already incorporated it into your projects!

It’s certainly possible to have hyperlinks to section titles, but it’s a little more work to do that. Since these docs are meant to be temporary, and will be added to official Plotly dash-docs in the near future, I didn’t add that feature.

Of course, if you don’t want to wait, pull requests are accepted! I can show you how to add the hyperlinks if you would like to contribute :slight_smile:

3 Likes

Thank you!

2 Likes

This is amazing! There are so many great features here; a number of which I’ve tried to implement in my own table components, but I love the attention and thought that has gone into these. Custom renderers in particular seems like such a great solution to provide unlimited customisability - I’ve already started transitioning to this from my own custom components and the experience has been pretty much seamless so far :slight_smile: .

3 Likes

Wow! That is very cool :slight_smile:

1 Like

Oh I didn’t realize the docs were temporary. I’m not in a rush, but I’d be happy to contribute to the official Docs (I’m guessing I’d need to wait until those are actually updated with the AG Grid stuff first, right?)

hi @the.oldest.house
Thank you for the offer. We’ll let you know what help we might need once the docs are officially out.

Hi,

Thanks for the release, it looks great.

I’ve trying to upgrade my version of dash ag grid to 2.0.0 (I’ve been using the alpha releases for a while) but I get that error message when trying to import the package:

Thank you for your interest in Dash AG Grid open source!
The 1.x series of this package is commercially distributed on
instances of Dash Enterprise Plotly: The front end for ML and data science models.

You have installed a non-functional stub version of the package.
This probably means you ran `pip install dash-ag-grid` and we
haven't yet released the final v2.0.0 open-source version.

To install an alpha release, you need to specify the version
exactly, for example `pip install dash-ag-grid==2.0.0a1`
See https://pypi.org/project/dash-ag-grid/#history
for the list of available versions.

!! Be aware there will likely be breaking changes before the
final v2.0.0 open-source release.

If you are a Dash Enterprise customer and you want to continue
using the v1.x series, please ensure you've installed dash-ag-grid
with the `--extra-index-url` argument, either in your requirements.txt
file or in the command line, so that the package is installed from
Dash Enterprise's private, commercial package repository instead of from
pypi.org. Visit the docs for your Dash Enterprise installation at:
https://<your-dash-enterprise-instance>/Docs
for details.

Could you please help me?

Hello @yoann_diep,

Welcome to the community!

Do you have any security settings that would keep you from downloading 2.0.0?

You could always set the version that you are downloading, like with how the alphas were downloaded.

@jinnyzor @AnnMarieW when Custom Dropdown Component with dmc.Select,how to achieve dynamic options

Hello @Sylvos,

What do you mean by dynamic?

You could always use an if statement inside the component in the JS to determine the array that you send to the data. If static.

If it is dependent upon your data from the server, then you can send it along with your data as data outside the column default and then pull it from the data.

like the example, options of dmc.Select based on the ‘Country’ column
https://dash.plotly.com/dash-ag-grid/cell-editors

You can do the same thing and feed that data to the data argument on dmc.Select.

...
data: params.values,
...

Something like that, or inside the function that you use to call the component:

if (selectedCountry === 'United States'`) {
    opts = ['Boston', 'Chicago', 'San Francisco']
}

...
data: opts,
...
1 Like

Are there any plans to add dash-ag-grid to conda / conda-forge? I’d love to add Dash AG Grid to one of my existing projects but have no experience mixing conda and pip.

hi @tcgeary
As of now, we don’t have plans to publish Dash Ag Grid to Conda. In fact, I don’t think we’ve published any Dash package there. If you see any, it most likely was published by someone else.

hi @jinnyzor
How can I activate the drop-down menu immediately when I single click a cell? I have set dashGridOptions={“singleClickEdit”: True}, but the drop-down menu only appears when I double-click the cell.

Hello @Sylvos,

To do this, I think you will need to make a custom component that starts opened.