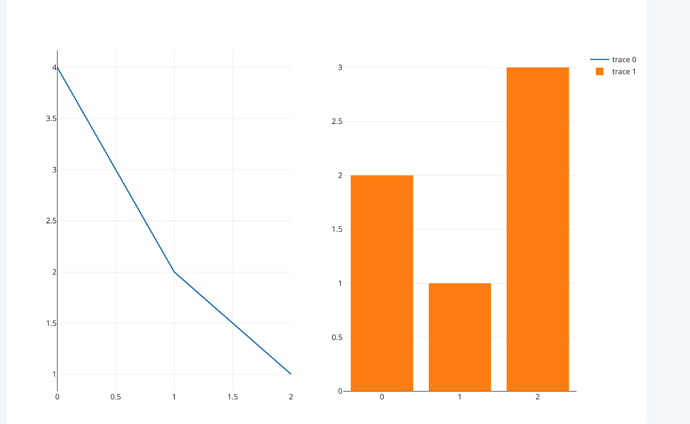
I am trying to simply run the Plotly Python Subplots tutorial from (https://plot.ly/python/creating-and-updating-figures/):
    from plotly.subplots import make_subplots

    fig = make_subplots(rows=1, cols=2)
    fig.add_trace(go.Scatter(y=[4, 2, 1], mode="lines"), row=1, col=1)
    fig.add_trace(go.Bar(y=[2, 1, 3]), row=1, col=2)
    fig.show()
and I am getting the following error:
**IndexError** : tuple index out of range
What am I doing wrong?
Thanks in advance
Yeah so it’s working for me. I pasted your exact code, the only thing I changed was :
from plotly import graph_objs as go
from plotly.tools import make_subplots
import plotly.plotly as py

fig = make_subplots(rows=1, cols=2)
fig.add_trace(go.Scatter(y=[4, 2, 1], mode="lines"), row=1, col=1)
fig.add_trace(go.Bar(y=[2, 1, 3]), row=1, col=2)
py.plot(fig)
So I would either update your Plotly version or import make_subplots from tools instead
Thank you. A poorly update and installing chart studio did the trick. Thanks!
