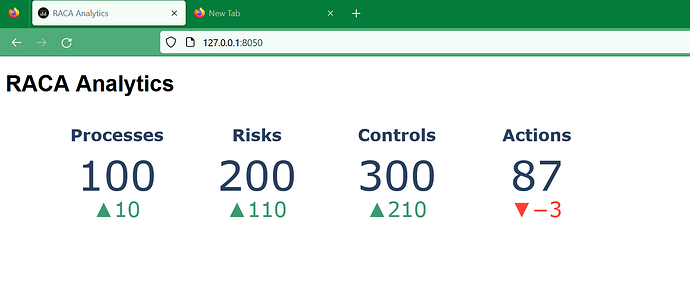
Hi All,
Dash - 2.9.3
Plotly - 5.14.1
Python 3.11.2
Windows 11
I am trying to create a Dash App using Bootstrap etc, but when I run it, the Indicators are way down the page/ I want them just under the H1 title. I have my browser set to 1920 x 1080
I have the following code section to do my dash layout.
# Bootstrap it up
# ------------------------------------------------------------------------------
app.layout = dbc.Container([
    dbc.Row(
        dbc.Col(html.H1("RACA Analytics"), className="text-center")),
    dbc.Row(
        dbc.Col([dcc.Graph(id='stats', figure=cards) ], xs=12, sm=12, md=12, lg=5, xl=5),
        ),
    ]
)

app.run_server(debug=True)
I have looked around but can’t see why it won’t move up closer. to the H1.
I have tried in multiple browsers but they are displaying the same
Full code below
import dash
from dash import dcc
from dash import html
import dash_bootstrap_components as dbc
import plotly.graph_objects as go

# Set Dash app title
app = dash.Dash(__name__, title='RACA Analytics')

cards = go.Figure()

cards.add_trace(go.Indicator(
    mode = "number+delta",
    value = 100,
    domain = {'row': 1, 'column': 0},
    title={"text": "<b>Processes</b>", 'font':{'size':24}},
    number={"font":{"size":60}},
        )
    )

cards.add_trace(go.Indicator(
    mode = "number+delta",
    value = 200,
    domain = {'row': 1, 'column': 1},
    title={"text": "<b>Risks</b>", 'font':{'size':24}},
    number={"font":{"size":60}},
        )
    )

cards.add_trace(go.Indicator(
    mode = "number+delta",
    value = 300,
    domain = {'row': 1, 'column': 2},
    title={"text": "<b>Controls</b>", 'font':{'size':24}},
    number={"font":{"size":60}},
        )
    )

cards.add_trace(go.Indicator(
    mode = "number+delta",
    value = 87,
    domain = {'row': 1, 'column': 3},
    title={"text": "<b>Actions</b>", 'font':{'size':24}},
    number={"font":{"size":60}},
        )
    )

cards.update_layout(
    grid = {'rows': 1, 'columns': 12, 'pattern': "independent"},
    template = {'data' : {'indicator': [{
        'mode' : "number+delta+gauge",
        'delta' : {'reference': 90}}],
                  }}
    )

# Bootstrap it up
# ------------------------------------------------------------------------------
app.layout = dbc.Container([
    dbc.Row(
        dbc.Col(html.H1("RACA Analytics"), className="text-center")),
    dbc.Row(
        dbc.Col([dcc.Graph(id='stats', figure=cards) ], xs=12, sm=12, md=12, lg=5, xl=5),
        ),
    ]
)

app.run_server(debug=True)```

Thanks for ant help.

Tom
