I am using Plotly with graph objects because I have subplots. As far as I know, this is not possible with plotly exp.?
The code posted ist the minimal example. At the bottom I attached the rest of the code.
So what you are telling me, it is not possible to create a simple legend by hand?
Thanks for your help.
outliers={'X': 0,'Y': 0,'Z': 0 }
sigma={'X': 0,'Y': 0,'Z': 0 }
def analyse( filename):
df = pd.read_csv(filename, float_precision='round_trip') # df= dfframe
listOfAxis=["X", "Y", "Z"]
fig={'X': None,'Y': None,'Z': None, }
for x in listOfAxis:
isNoise='is Noise '+str(x)
#denoise(df, x,isNoise)
sigma[x]=denoise(df, x,isNoise)
df = pd.read_csv(filename, float_precision='round_trip') # df= dfframe
for x in listOfAxis:
isNoise='is Noise '+str(x)
countNoise(df, x,isNoise,sigma[x])
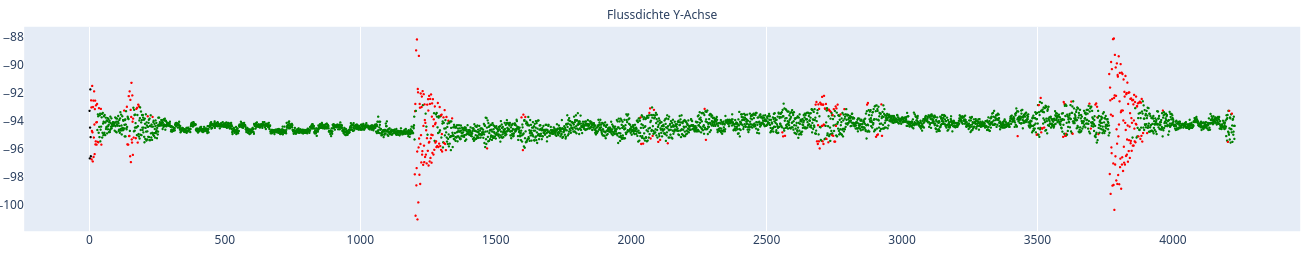
fig[x] = go.Scatter(y=df[x],
                                    mode="markers",
                                    marker=dict(
                                            color=df[isNoise]))
print("#########"+str(filename)+"#########")
strX=" Störungen auf der X-Achse: "+str(round(outliers["X"]/len(df.index),3))+"%"
strY=" Störungen auf der Y-Achse: "+str(round(outliers["Y"]/len(df.index),3))+"%"
strZ=" Störungen auf der Z-Achse: "+str(round(outliers["Z"]/len(df.index),3))+"%"
print(strX)
print(strY)
print(strZ)
print("###########################")
#df = pd.concat([row_df, df], ignore_index=True)
fig_main = make_subplots(
rows = 3,
cols = 1,
#specs=[[{"type": "scatter"},{"type": "scatter"},{"type": "scatter"}]],
specs=[[{"type": "scatter"}],[ {"type": "scatter"}], [{"type": "scatter"}]],
subplot_titles = ("Flussdichte X-Achse", "Flussdichte Y-Achse", "Flussdichte Z-Achse"))
fig_main.add_trace(fig['X'], row=1, col=1)
fig_main.add_trace(fig['Y'], row=2, col=1)
fig_main.add_trace(fig['Z'], row=3, col=1)
fig_main.add_annotation(dict(font=dict(color='black',size=20),
x=0,
y=0.70,
showarrow=False,
text=strX+strY+strZ,
textangle=0,
xanchor='left',
xref="paper",
yref="paper"))
fontsize=30
fig_main.update_layout( title_text=filename,
#height=595,
#width=842,
width=3508,
height=2480 ,
title_font_size=fontsize,
legend_font_size=fontsize,
legend_grouptitlefont_size=fontsize,
legend_title_font_size=fontsize,
font_size=fontsize,
hoverlabel_font_size=fontsize,
showlegend=True,
hoverlabel_grouptitlefont_size=fontsize,
title={ #https://community.plotly.com/t/margins-around-graphs/11550/4
"yref" : "container",
"y" : 0.99,
"yanchor" : "top"
})
fig_main.update_annotations(font_size=fontsize)
plotly.offline.plot(fig_main, filename='page.html')