My problem
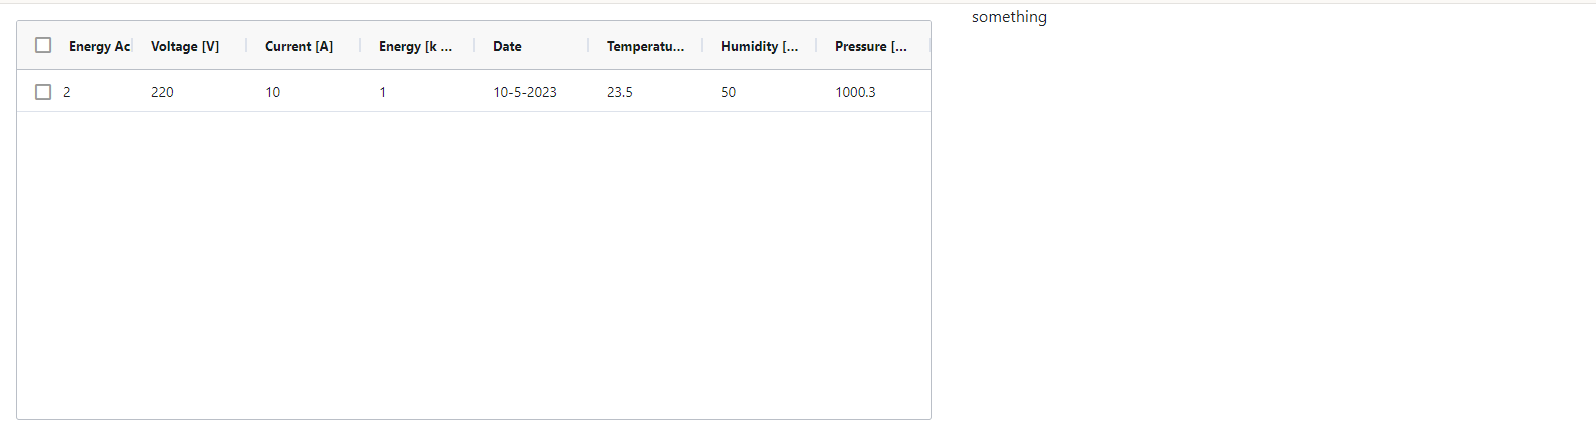
Hi, I’m trying to make a table using dash_ag_grid with some columns and autosize them, but the width of the columns does not allow the headers to be seen correctly.
Obatined table
Target table:

My code:
from dash import Dash, html
import dash_bootstrap_components as dbc
import dash_ag_grid as dag
import pandas as pd

app = Dash(__name__, external_stylesheets=[dbc.themes.BOOTSTRAP])

#measure table
df = pd.DataFrame(
  {"Energy Acumulated [kWh]": [2],
   "Voltage [V]": [220],
   "Current [A]":[10],
   "Energy [kWh]": [1],
   "Date":["10-5-2023"],
   "Temperature [°C]":[23.5],
   "Humidity [%]":[50.0],
   "Pressure [hPa]":[1000.3],
  }
)

columnDefs = [
{"field": "Energy Acumulated [kWh]","checkboxSelection": True, "headerCheckboxSelection": True,},
{"field": "Voltage [V]"},
{"field": "Current [A]"},
{"field": "Energy [kWh]"},
{"field": "Date"},
{"field": "Temperature [°C]"},
{"field": "Humidity [%]"},
{"field": "Pressure [hPa]"},
]

defaultColDef = {
                 "minWidth": 1,
                 "sortable": True,
                 "resizable": True,
                 "filter": False}

meas_table=[
    dag.AgGrid(
        id="grid",
        columnDefs=columnDefs,
        rowData=df.to_dict("records"),
        defaultColDef=defaultColDef,
        dashGridOptions={"rowSelection":"multiple"},
        columnSize="responsiveSizeToFit",
        #columnSize="autoSize",
    )
]

app.layout =dbc.Row([
              dbc.Col(
                html.Div(
                    meas_table,
                    className="m-3")
              ),
              dbc.Col(html.Div("something")),
              ])

app.run_server(debug=True)
This run in W10 with:
- python 3.11.5 64-bit,
- dash 2.14.2,
- dash_bootstrap_components 1.5.0,
- dash_ad_grid 31.0.1,
- pandas 2.1.1
Expected answer
A modification of my code that adjusts the widths of the columns well, if it can be done automatically, great, but if the only way is to adjust the widths individually, I am also interested in knowing how to do it.
Thanks for your time.


