Hello everyone!
I’m developing a dash application to display some geographical data on a map of the Minas Gerais state here in Brazil. So i’ve got the appropriate .shp files in order to draw the state’s map.
I prototyped it via jupyter lab (using only plotly, no dash app) and it worked correctly, but when i try to do the same thing in a dash app via pycharm I get a blank world map. The color data is nowhere to be seen nor is the map limited to the fitbounds parameter.
What makes it even weirder is that if i place a fig.show() as the last line in my callback function a correctly plotted map pops into my browser, while the map in the dash app is still blank. I even tried to put info that would be fed via callback input directly inside the function, but to no avail. Also, the colorbar displays correctly, so the data is somewhat not enterily lost.
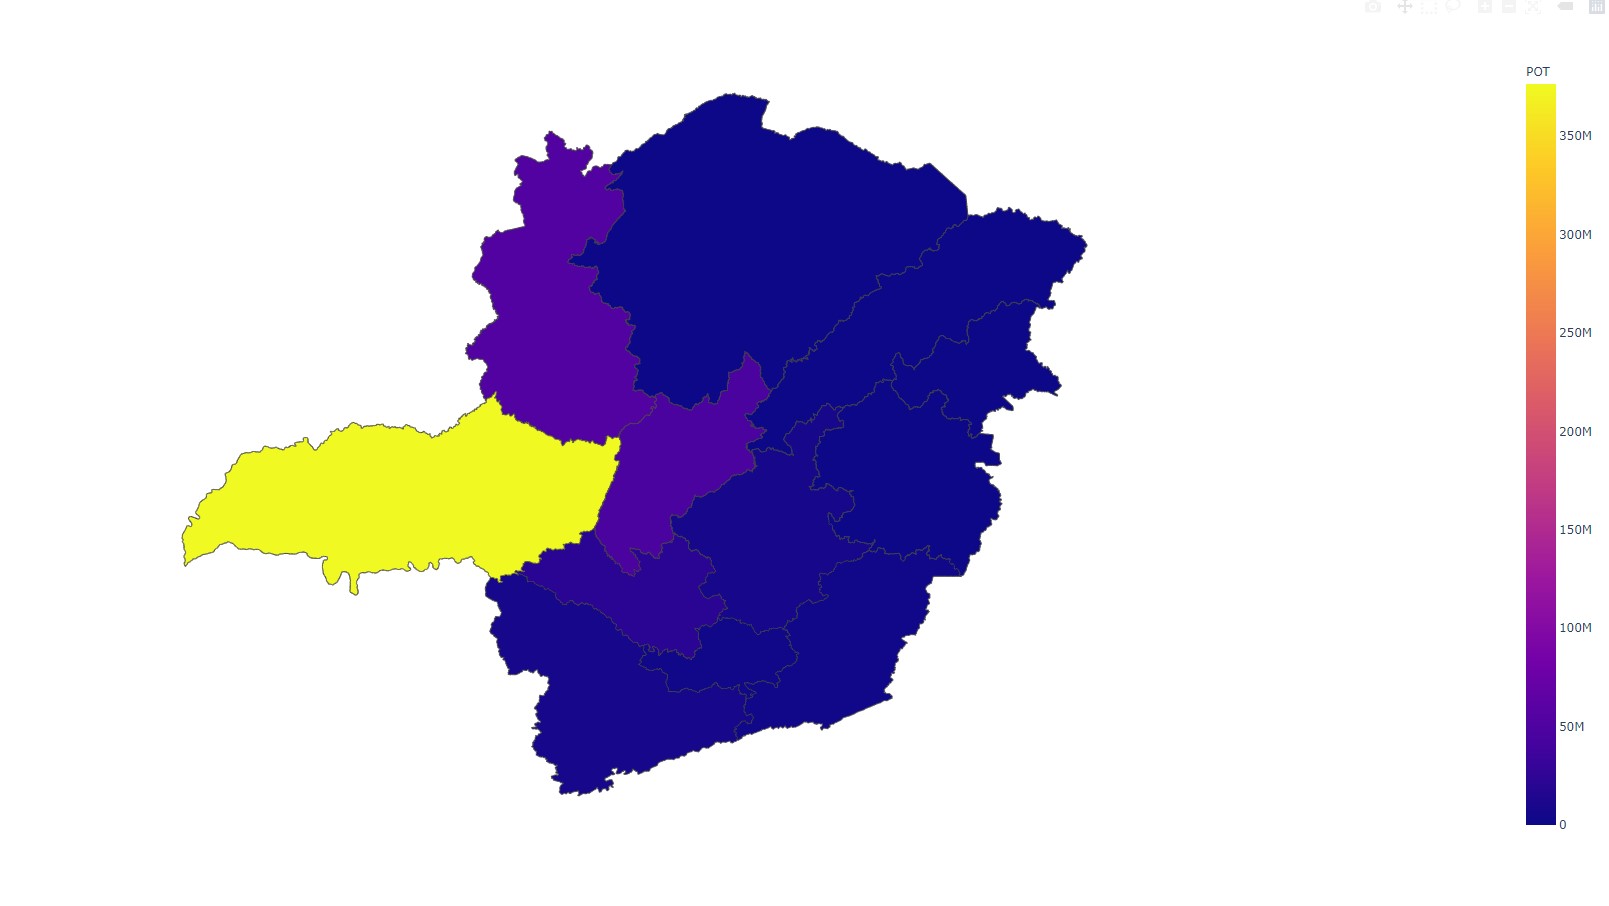
Here is what appears via fig.show():
And here is what appears in the dash app:

And finally, here is the callback code:
@app.callback(
    Output('map', 'figure'),
    [Input('fontes', 'value')]
)
def plotmap(*vals, df_wide=df_wide, geo_mes=geo_mes):

    df_filter = df_wide[['NM_MES', 'NM_MIC', 'NM_MUN']].copy()  # Getting region's names

    # Filtering by substract

    subs = ['CORTE', 'VINHACA']

    for sub in subs:
        df_filter[sub] = df_wide[sub]

    # defining scope - in this test = mesoregion

    scope = 'NM_MES'

    # Melting the dataframe

    df_melt = df_filter.melt(id_vars=['NM_MUN', 'NM_MES', 'NM_MIC'],
                             value_vars=df_filter.columns[3:],
                             var_name='SUBS',
                             value_name='POT')
    # Grouping by the scope

    df_group = df_melt.groupby([scope]).sum().sort_values(by='POT', ascending=False)

    # Resetting index

    df_group.reset_index(inplace=True)

    # mergind geo data with z

    df_plot = geo_mes.merge(df_group, how='left', on='NM_MES')

    df_plot.set_index('NM_MES', inplace=True)

    fig = px.choropleth(df_plot,
                        geojson=df_plot.geometry,
                        locations=df_plot.index,
                        color='POT',
                        hover_name=df_plot.index)
    fig.update_geos(fitbounds="locations", visible=False)

    fig.show()

    return fig
Please note that the *vals input is not being used because i manually placed an equivalent input inside the function as the “subs” list in an attempt of troubleshooting.
Also, i’m using geopandas with px as demosntradd in the following link (i don’t think this is the problem as it works in jupyterlab and in the fig.show().
Sorry if this problem have already been solved in another discussion.
Any ideas?