Hello,
I am hoping to reduce the hover fields that appear on a box plot.
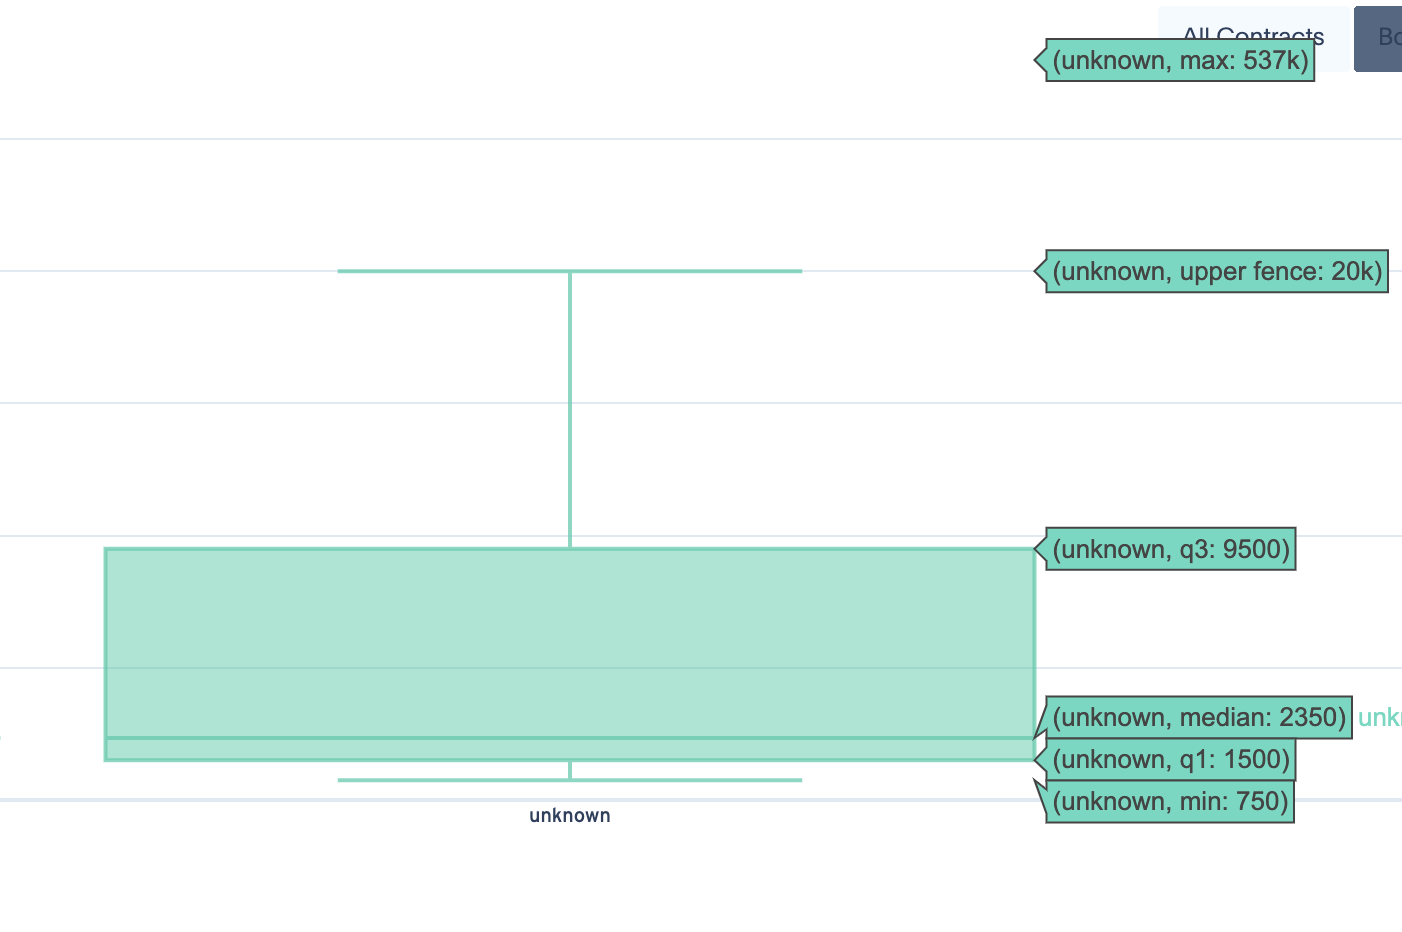
I’m grouping a several boxplots on a figure and the only information the user will need is the min, max and median. Leaving the upper/lower fence, Q1 and Q3 adds a lot of chaos when there are lots of box plots in a single figure.
Basically, from this:
to this:

Thus far I have only been able to change the hover text and template for points.
Is this possible?
Thank you!