Hi @shoops,
Glad to help as brand-new member of the forum! ![]()
It’s a kind of trick, like described in the previous example:
Date axis tick labels have the special property that any portion after the first instance of ‘\n’ in
tickformatwill appear on a second line only once per unique value, as with the year numbers in the example below. To have the year number appear on every tick label,'<br>'should be used instead of ‘\n’.
Indeed I didn’t find a way to display labels on minor ticks ![]()
I ran some tests using this example, it seems that they don’t play well together
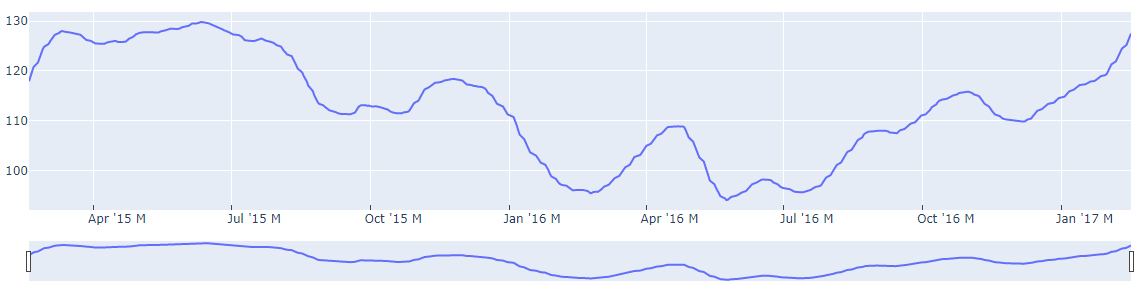
Vanilla

With ticklabelmode="period"
It seems the labels shift a little, but not in the center of the periods
With ticklabelmode="period" and dtick="M1"
The labels come back on ticks

Zooming to have horizontal labels

Anyway, it seems it is not possible to define custom tick periods depending on the zoom level.
tickformatstops only allows to define only labels format depending on the zoom level
Maybe the solution can be to create a kind of custom tickformatstops using Dash and Graph prop relayoutData as input of a callback, which is triggered with zoom/pan. See exemple here