Capture which items are displayed on Python Express chart based on legend selection

DISTRIB_DESCRIPTION=“Ubuntu 20.04.5 LTS”
Streamlit, version 1.12.2
plotly==5.10.0

I have a Plotly Express px.scatter chart being generated in a Streamlit page. The different data points available to be shown are set by the color= parameter in …

fig = px.scatter(x=df[x_column_name], 
                 y=df[y_column_name], 
                 color=df[color_column_name])

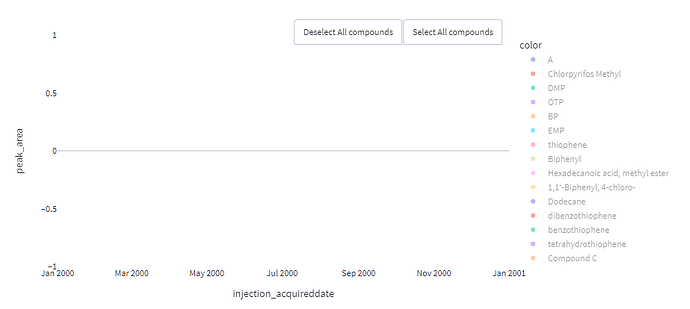
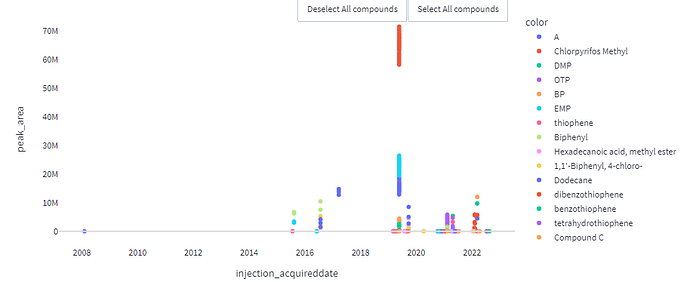
Which data (color) points are actually shown on the chart can be selected in the legend (see images.)

Is there a way to detect in the code (via the fig or something else) which data points (colors) have actually been selected in the legend to appear on the chart? I.e. In the example pictures, for the Streamlit (Python) code to know that only DMP, OTP, and BP are currently being seen on the plotly chart?

All selected

None selected

DMP, OTP, BP selected

FULL CODE

def control_chart_by_compound(df, 
                  x_column_name, 
                  y_column_name, 
                  color_column_name,
                  chart_width = 800,
                  marker_line_width = 1,
                  standard_deviation = False, 
                  stddev_colors = ["#CCFF00","#FFCC99","#FF9966"], 
                  average = False, 
                  average_color = "green", 
                  custom_marker_lines = [], 
                  custom_marker_lines_colors = []
                 ):
    
    if custom_marker_lines_colors == []:
        custom_marker_lines_colors = CSS_blues()

    fig = px.scatter(x=df[x_column_name], 
                     y=df[y_column_name], 
                     color=df[color_column_name], 
                     width=chart_width, 
                     labels={
                         "x": x_column_name,
                         "y": y_column_name,
                         color_column_name: "Compounds"
                     },
                    )

    # Adds buttons select or deselect all amongst the legend (default the compounds as different colors)
    fig.update_layout(dict(updatemenus=[
                            dict(
                                type = "buttons",
                                direction = "left",
                                buttons=list([
                                    dict(
                                        args=["visible", "legendonly"],
                                        label="Deselect All compounds",
                                        method="restyle"
                                    ),
                                    dict(
                                        args=["visible", True],
                                        label="Select All compounds",
                                        method="restyle"
                                    )
                                ]),
                                pad={"r": 10, "t": 10},
                                showactive=False,
                                x=1,
                                xanchor="right",
                                y=1.1,
                                yanchor="top"
                            ),
                        ]
                  ))

    if average != False: 
        fig.add_hline(y=np.average(df[y_column_name]), 
                      line_color=average_color, 
                      line_width=marker_line_width, 
                      line_dash="dash")

    # Add zero hline
    fig.add_hline(y=0, line_color="gainsboro")

    ### Standard deviations
    if standard_deviation != False:
        stddev = df[y_column_name].std()
        for idx, color in enumerate(stddev_colors):
            fig.add_hline(y=stddev * (idx+1), line_color=color, line_width=marker_line_width,)
            fig.add_hline(y=-stddev * (idx+1), line_color=color, line_width=marker_line_width,)

    for idx, line in enumerate(custom_marker_lines):
        fig.add_hline(y=line, line_color=custom_marker_lines_colors[idx], line_width=marker_line_width,)
        fig.add_hline(y=-line, line_color=custom_marker_lines_colors[idx], line_width=marker_line_width,)
        
    # Background to clear
    fig.update_layout({
    'plot_bgcolor': 'rgba(0, 0, 0, 0)',
    'paper_bgcolor': 'rgba(0, 0, 0, 0)',
    })
    
    fig.update_layout(xaxis=dict(showgrid=False),
                      yaxis=dict(showgrid=False))
    
    return fig
hi Mike (@rightmirem)
Welcome to the community.

If you’re using Dash, you can detect the legend trace clicked. Here’s an example, where my_traces is a list of visible traces on the graph, based on clicked legend items:

from dash import Dash, html, dcc, Output, Input, callback
import plotly.express as px
import pandas as pd

df = px.data.iris()
app = Dash(__name__)

fig = px.scatter(df,
                x="sepal_width",
                y="sepal_length",
                color="species",
                size='petal_length',
                hover_data=['petal_width']
)

my_traces = len(fig['data'])
my_traces = list(range(my_traces))
print(my_traces)


app.layout = html.Div(
    [
        my_figure := dcc.Graph(figure=fig),
        container_text := html.Div()
    ]
)


@callback(
    Output(container_text, "children"),
    Input(my_figure, "restyleData"),
    Input(my_figure, "figure"),
    prevent_initial_call=True
)
def legend_value(legend_value, figure_data):
    print(legend_value)
    if legend_value[0]['visible'] == ['legendonly']:
        my_traces.remove(legend_value[1][0])
        print(my_traces)
    elif legend_value[0]['visible'] == [True]:
        my_traces.append(legend_value[1][0])
        print(my_traces)

    return []


if __name__ == '__main__':
    app.run_server(debug=True)

Thanks for the reply, and the welcome. For now, we’re locked into using Streamlit - and I don’t think I can use Dash within Streamlit (unless you know how :D)

If there isn’t an interface to capture the data, is it possible to steal it directly? I.e. Access the list/dict/whatever object within the Plotly code that contains the selected items? Surely, it should be in there somewhere?

I am not sure, but maybe you could search the figure dictionary fig.to_dict()

EDIT: I tried it just now, I did not find anything.