Recently, I tried designing a custom “CandlestickGL” using three ScatterGL traces per candle, which works visually — but it’s quite tricky to maintain and update efficiently in real time.
Any ideas or best practices are welcome! ![]()
I’ve been working on a trading application built with Dash and Python, where I update streaming ticks using clientside callbacks to refresh the UI in real time.
Initially, my rendering performance with
plotly.redrawwas around 300 ms. After switching all my traces toScatterGL, the performance improved dramatically to 150 ms, which is amazing.However, there’s still one bottleneck: my candlestick trace.
SinceScatterGLdoes not support arrays forline.colorandline.width, I can’t properly simulate a multi-colored candlestick using it.Has anyone found a way to replicate a candlestick chart using ScatterGL (or another GPU-accelerated approach)?
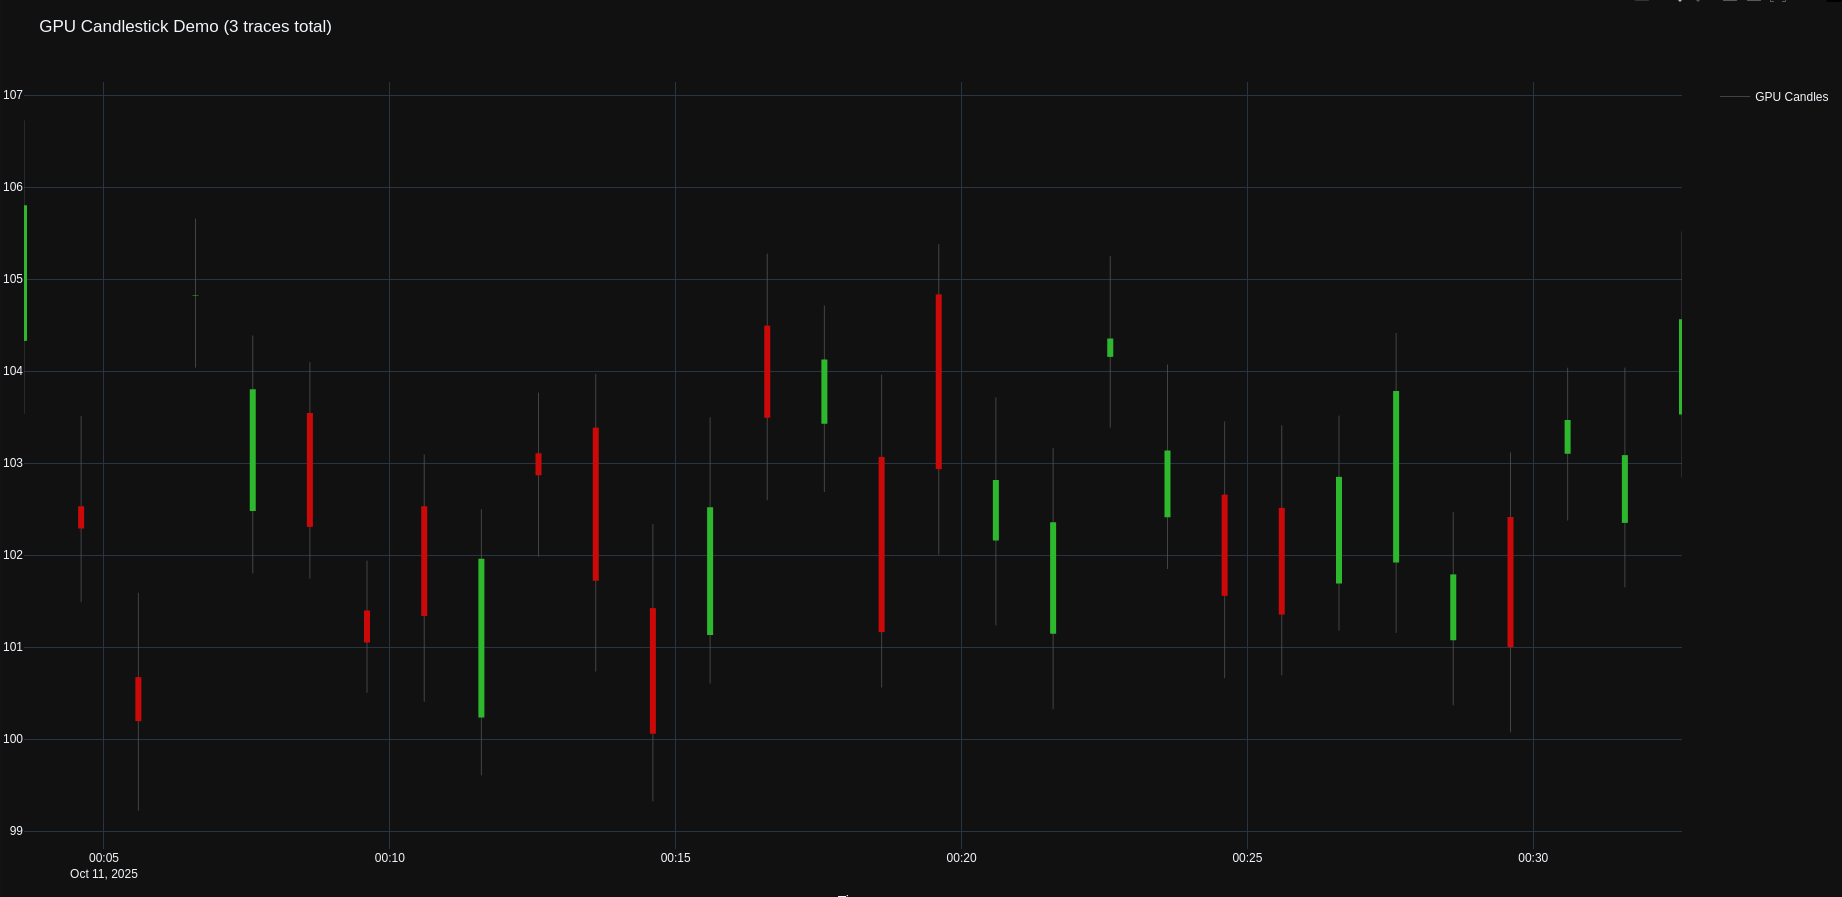
obtaining results aspicture shows.
i want to get to now, if there ir a way to implementing this, using only 1 trace, or if someone here have handled same ?
my snippet is this;
import plotly.graph_objects as go
import numpy as np
from datetime import datetime, timedelta

# ============================
# 🔹 Datos de ejemplo
# ============================
n = 30
base_time = datetime.now()
times = [base_time + timedelta(minutes=i) for i in range(n)]
opens = np.random.uniform(100, 105, n)
closes = opens + np.random.uniform(-2, 2, n)
highs = np.maximum(opens, closes) + np.random.uniform(0.5, 1.0, n)
lows  = np.minimum(opens, closes) - np.random.uniform(0.5, 1.0, n)

candlestick = dict(
    opentimes=times,
    openprices=opens,
    highprices=highs,
    lowprices=lows,
    closeprices=closes,
)

# ============================
# 🔹 Función 3-trace GPU
# ============================
def make_candlestickgl_compact(candlestick, name="candlestick", visible=True):
  x_wick, y_wick, text_wick = [], [], []
  x_bull, y_bull, text_bull = [], [], []
  x_bear, y_bear, text_bear = [], [], []

  times = candlestick["opentimes"]
  openp = candlestick["openprices"]
  highp = candlestick["highprices"]
  lowp  = candlestick["lowprices"]
  closep= candlestick["closeprices"]

    for i in range(len(times)):
        t = times[i]
        o = openp[i]
        h = highp[i]
        lo = lowp[i]
        c = closep[i]
        is_bull = c >= o

        hovertxt = (
            f"<b>{name}</b><br>"
            f"O: {o:.2f}<br>H: {h:.2f}<br>L: {lo:.2f}<br>C: {c:.2f}<br>"
            f"Type: {'Bull' if is_bull else 'Bear'}"
        )

        # Mecha
        x_wick += [t, t, None]
        y_wick += [lo, h, None]
        text_wick += [hovertxt, hovertxt, None]

        # Cuerpo
        if is_bull:
            x_bull += [t, t, None]
            y_bull += [o, c, None]
            text_bull += [hovertxt, hovertxt, None]
        else:
            x_bear += [t, t, None]
            y_bear += [o, c, None]
            text_bear += [hovertxt, hovertxt, None]

    wick_trace = go.Scattergl(
        x=x_wick, y=y_wick, mode="lines",
        line=dict(color="rgba(80,80,80,0.8)", width=1),
        text=text_wick, hoverinfo="text",
        name=name, legendgroup=name, showlegend=True, visible=visible,
    )
    bull_trace = go.Scattergl(
        x=x_bull, y=y_bull, mode="lines",
        line=dict(color="rgba(46,184,46,1)", width=6),
        text=text_bull, hoverinfo="text",
        name=name, legendgroup=name, showlegend=False, visible=visible,
    )
    bear_trace = go.Scattergl(
        x=x_bear, y=y_bear, mode="lines",
        line=dict(color="rgba(203,9,9,1)", width=6),
        text=text_bear, hoverinfo="text",
        name=name, legendgroup=name, showlegend=False, visible=visible,
    )
    return [wick_trace, bull_trace, bear_trace]

# ============================
# 🔹 Crear figura y mostrar
# ============================
traces = make_candlestickgl_compact(candlestick, "GPU Candles")
fig = go.Figure(data=traces)
fig.update_layout(
    title="GPU Candlestick Demo (3 traces total)",
    xaxis_title="Time",
    yaxis_title="Price",
    template="plotly_dark",
)
fig.show()