Hi there, I’m working on a bar chart and want to create two buttons to switch between horizontal and vertical views. However, the vertical view does not show up – my code for the change in x-axis doesn’t seem to work.
Below are screenshots of the malfunction and my code:
Horizontal view

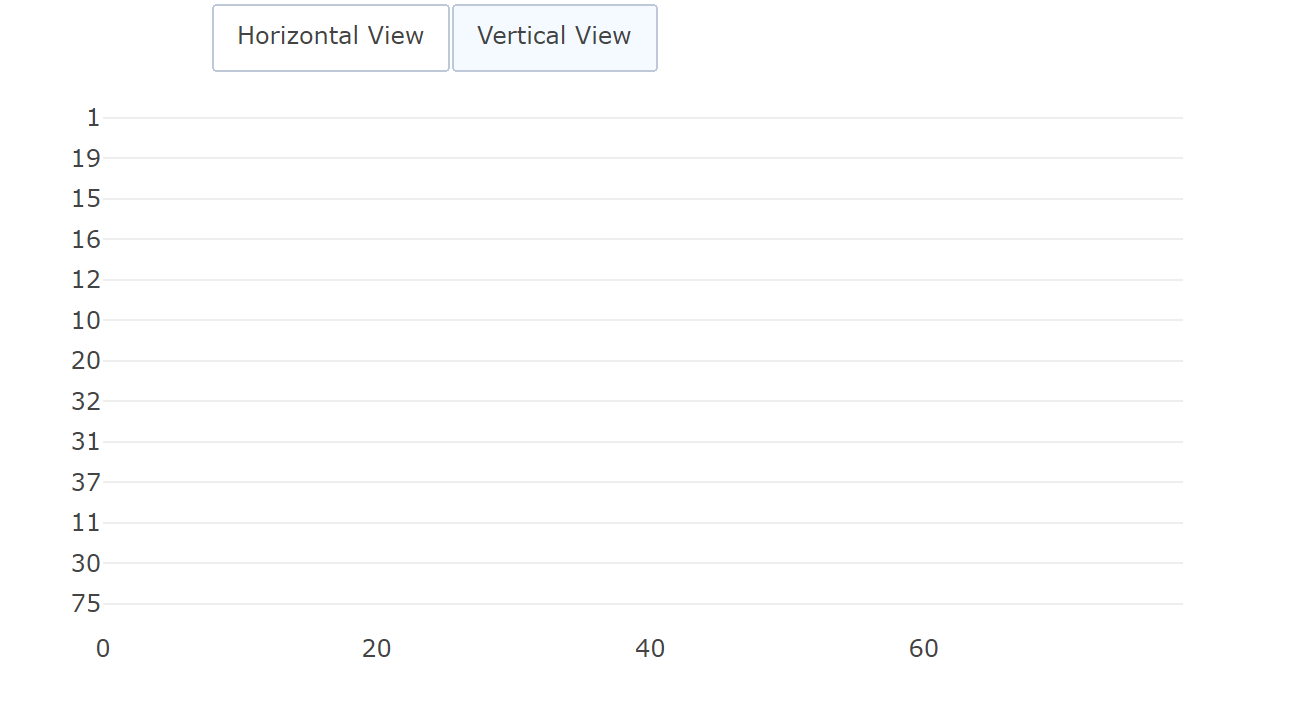
Vertical view (x axis did not switch, y axis not in counts but in categories)
var data = [
    //horizontal graph
    {
      type: 'bar',
      x: xData2,
      y: yData2,
      marker: {
        color: 'rgba(255, 100, 102, 0.7)',
      },
      name:'Bar Chart',
      orientation:'h',
      xaxis: { title: 'Count' },
      yaxis: { title: xAxisAttribute },

    },
    //vertical graph
    {
      type: 'bar',
      y: yData,
      x: xData,
      orientation:'v',
      marker: {
        color: 'rgba(255, 100, 102, 0.7)',
      },
      name:'Bar Chart',
      visible: false
    }]
  var button_layer_2_height = 1.2;
  var updatemenus=[
      {
          buttons: [
              {
                  args: [{'visible': [true, false]}],
                  label: 'Horizontal View',
                  method: 'update'
              },
              {
                  args: [{'visible': [false, true]}],
                  label: 'Vertical View',
                  method: 'update'
              },
          ],
          direction: 'left',
          pad: {'r': 10, 't': 10},
          showactive: true,
          type: 'buttons',
          x: 0.1,
          xanchor: 'left',
          y: button_layer_2_height,
          yanchor: 'top'
      },
  ]
  let layout = {
    title: title || 'Untitled',
    autosize: true,
    hovermode:'closest',
    updatemenus: updatemenus,
    };

  return (
    <div>
      <Plot
        data ={data}
        layout = {layout}
        config = {config}
          />
      </div>
    )
    }