Plotly version: 6.2.0
Python version: 3.11.13
Browser: chrome
Hi, i have found quite annoying bug which can be seen only when the isosurface components are opaque. I observed that it doesn’t only occur for multiple trace isosurfaces, but also single multisurface isosurfaces and volume plots.
Here is an example code how to replicate it:
import plotly.graph_objects as go
import numpy as np
import nrrd
from skimage.transform import resize


volume = np.zeros((50, 50, 50))
volume[1:10, 5:45, 5:45] =1
volume[10:20, 5:45, 5:45] = 1.5
volume[20:30, 5:45, 5:45] = 2
volume[30:40, 5:45, 5:45] = 2.5
volume[40:49, 5:45, 5:45] = 3
Z, X, Y = np.mgrid[0:volume.shape[0]:1, 0:volume.shape[1]:1, 0:volume.shape[2]:1]


fig = go.Figure(data=[go.Isosurface(
    x=X.flatten(),
    y=Y.flatten(),
    z=Z.flatten(),
    opacity=0.99,
    value=np.where(volume == 1, 1, 0).flatten(),
    surface_fill=1,
    surface_count=1,
    colorscale=[[0, 'rgb(0,255,0)'], [1, 'rgb(0,255,0)']],
    caps=dict(x_show=False, y_show=False, z_show=False),
    #slices_z=dict(show=True, locations=list(range(volume.shape[0]))),
    ),
    go.Isosurface(
        x=X.flatten(),
        y=Y.flatten(),
        z=Z.flatten(),
        opacity=0.99,
        value=np.where(volume == 3, 1, 0).flatten(),
        surface_fill=1,
        surface_count=1,
        colorscale=[[0, 'rgb(255,0,0)'], [1, 'rgb(255,0,0)']],
        caps=dict(x_show=False, y_show=False, z_show=False),
        # slices_z=dict(show=True, locations=list(range(volume.shape[0]))),
    )])
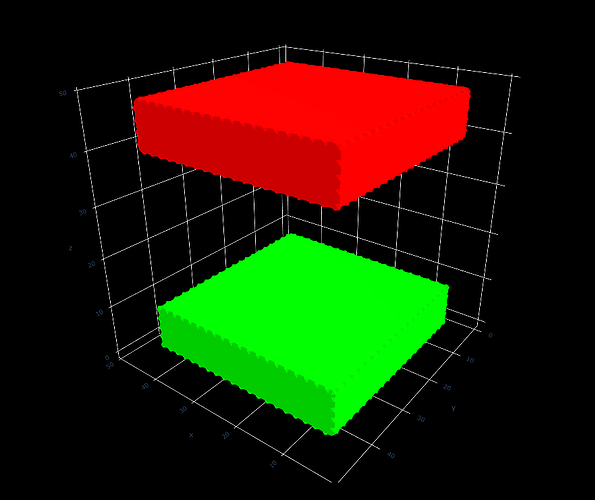
The created plot:
The bug can be seen looking form under the plot:
The fun part is that when you change the opacity from 0.99 to 1 the plot gets visualised properly.

