Hi everyone,
I’m relatively new to plotly and it looks like an amazing tool to me! As a new user, I’m very excited, although I’ve been running into an issue that I hope very much you could help me with.
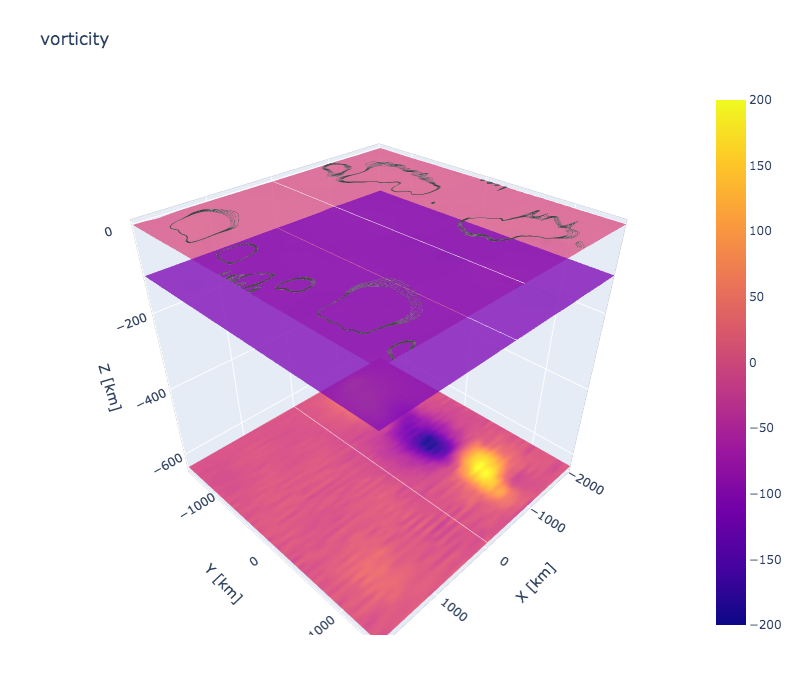
In short, I’m using plotly for the post-processing analysis of the vorticity field of my 3d simulations.
I have a cartesian domain and I’d like to plot the result of my function in the XY plan at three different depths. My domain in Z is 0-(-)660km and I want to have these plans visualised in 3d at 0km, -110km and -660km.
- the values of the function at different plans of different depth are different.
problem #1: I can’t get to plot the function, which goes approx from -5 to 10, at different depths. I am also not sure if a surface or a volume plot would be the best choice here.
An example of this where x2-y2 is the 2d plane and z2 to z4 are the different vorticity functions
would be:

fig = go.Figure(data=[go.Surface(
contours = {
“x”: {“show”: True, “start”: 1.5, “end”: 2, “size”: 0.04, “color”:“white”},
“z”: {“show”: True, “start”: 0.5, “end”: 0.8, “size”: 0.05}
},
z=z2, x=x2, y=y2, cmin=-200, cmax=200)])fig = go.Figure(data=[go.Surface(z=z3, x=x2, y=y2, cmin=-200, cmax=200)])
fig = go.Figure(data=[go.Surface(z=z4, x=x2, y=y2, cmin=-200, cmax=200)])
fig.update_layout(scene =
dict( xaxis = dict(nticks=4, range=[-2000,2000],),
yaxis = dict(nticks=4, range=[-1500,1500],),
zaxis = dict(nticks=4, range=[-660,0],),),
title=‘vorticity’, autosize=False,
width=800, height=700,
margin=dict(l=65, r=50, b=65, t=90)
)
fig.update_layout(scene = dict(
xaxis_title=‘X [km]’,
yaxis_title=‘Y [km]’,
zaxis_title=‘Z [km]’),
)fig.show()
when I do this they overwrite themself, I’m a bit confused. Thank you very much to who will answer this post and Merry Christmas to everyone! ![]() if necessary I can provide a github-binder version of this.
if necessary I can provide a github-binder version of this.
R.