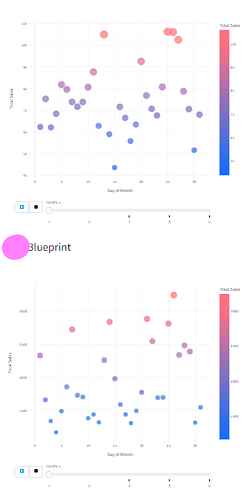
I have created two bubble charts on a single page, but I have noticed that one of the charts is not functioning properly. Specifically, when I hover the cursor over the chart, it displays the corresponding value, but it fails to render the scatter bubbles. I am seeking suggestions on how to fix this issue.
Code:
fig = px.scatter(df, x=‘day’, y=‘actualSales’, size=‘actualSales’, color=‘actualSales’, hover_data=‘actualSales’)
Also suggest if it is possible to combine both the charts in one single chart.
hi @ELANGO
can you please share a minimal reproducible example? Sample code with sample data so we can run this locally on our computers?
I sincerely appreciate your attention to this matter. I regret to inform you that I am unable to publicly share the data as it is connected to mongoDB and can only be accessed within the server. The two charts in question are embedded within a callback function and display values for the years 2022 and 2023. Both charts include a slider ranging from 1 to 12 months, along with an animation frame. While one graph renders successfully for the entire 12-month period, the other graph unfortunately fails to render. (Note: It is one of the page in multi page app).
The above image for 2023 - 5 months data is being displayed perfectly.
But for 2022 - 12 months data first graph displays it properly, second graph shows the data points but failed to render the bubbles. Both code are same.
Thanks in advance to the Plotly Team for their exceptional support and dedication in resolving this issue. And Thank you for your continuous support.
hi @ELANGO
I’ll keep thinking about what might be the problem here.
In the meantime, are you able to replicate this error with a small fake dataset (csv file maybe) and two bubble charts?
If the bubbles have data, but the colors are not rendered, is this an opacity issue? Maybe you can add:
fig.update_traces(marker=dict(opacity=1))
fig.show()
Or, are you using rgba for color, with 0 on the end? This controls alpha. If so, revise to 1 for full visibility.
Could you have unintentionally set the size to zero?
fig.update_traces(marker=dict(size=20))
fig.show()
I have checked two graphs with same field from the DataBase. Both rendering properly for 12 months data. I’ll check our database what is the problem in that another field for the year 2022 and I’ll report it here…
Thanks a lot for plotly team.
Thanks it is working!!


