Hi
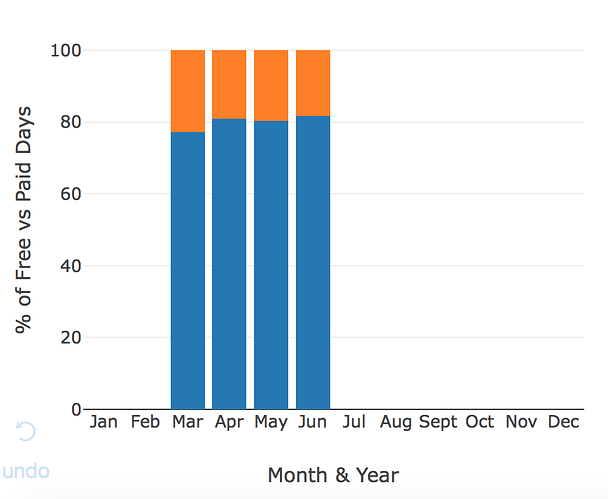
I have a stacked bar chart on the second tab of my Dash app. On tab 2 is also a drop down, which when I change it, updates my stacked bar chart to look like this:
If I then click back to tab1 and back to tab2, the stacked bar chart is displayed correctly with the correct data:
If I now change the drop down again the same thing happens and it’s fixed by swapping tab and back again etc.
I have a pie chart on tab 2 as well, which updates and displayed correctly when the same drop down is changed. The pie chart has it’s own call back with the same input:
[dash.dependencies.Input(‘site1_selector’, ‘value’)])
The relevant app layout code is this:
                html.Div([
                dcc.Graph(
                    id='Graph9',
                    figure={
                        'data' : [trace11, trace12],
                        'layout' : go.Layout(
                            barmode='stack',
                            title='Monthly Split of Free vs Purchased Days',
                            xaxis=dict(title='Month & Year'),
                            yaxis=dict(title='% of Free vs Paid Days'),
                            width=10,
                        )
                    },
                ),
            ], className='six columns'),
And my callback is this:
@app.callback(dash.dependencies.Output('Graph9', 'figure'),
                   [dash.dependencies.Input('site1_selector', 'value')])

def change_site1(site):

(some functions to generate free_trace and paid_trace)

return {
        'data' : [free_trace, paid_trace],
        'layout' : go.Layout(
            barmode='stack',
            title='Monthly Split of Free vs Purchased Days',
            xaxis=dict(title='Month & Year'),
            yaxis=dict(title='% of Free vs Paid Days'),
            width=10,
        )
}
Any ideas on this one?
Thanks
Chris

