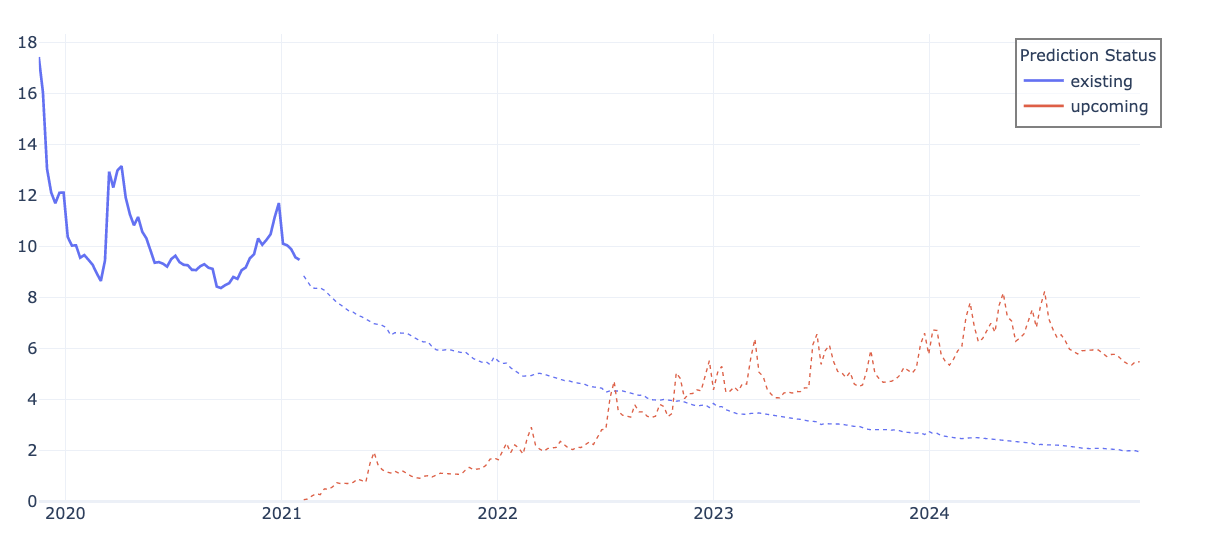
I am trying to create an area chart with two series. The two series begin on different days, but it keeps auto-backfilling the second series to the start date of the first series. See below:

The cut-off between my “existing” and “upcoming” predictions 2021-01-31. So the “upcoming” predictions should begin on 2021-02-01. But, as you can see the “upcoming” prediction now have a red line that sits on top of the “existing” prediction, going back late 2019.
My dataframe is formatted like so:
calendar_date | existing | upcoming | prediction |
------------- | ---------| ---------| -----------|
2019-10-01    | 17.5     | np.NaN   | 0          |
2019-10-02    | 15.0     | np.NaN   | 0          |
...           | ...      | ...      |  ...       |
2021-01-31    | 9.7      | np.NaN   | 0          |
2021-02-01    | 9.5      | 0.05     | 1          |
2021-02-02    | 9.5      | 0.07     | 1          |
...           | ...      | ...      |  ...       |
2024-12-30    | 2.1      | 5.5      | 1          |
2024-12-31    | 2.1      | 5.6      | 1          |
My abstracted code for this chart is:
    fig = go.Figure(layout={
                    'height':500,
                    'template':'plotly_white',
                    'paper_bgcolor':'rgba(255,255,255,0.5)',
                    'margin' : {'b' : 50}
                    }
           )

    for prediction_status in [col for col in my_data.columns if col!='prediction']:

        ##plot actuals
        fig.add_trace(go.Scatter(x=my_data[my_data['prediction']==0].reset_index()[calendar_date]
                             ,y=my_data[my_data['prediction']==0][prediction_status],
                        mode='lines',
                        marker={'color':colors[prediction_status] },
                        name=sub_level,
                        stackgroup='stack',
                        legendgroup=prediction_status

                            ))

        ## plot forecast
        fig.add_trace(go.Scatter(x=my_data[my_data['prediction']==1].reset_index()[calendar_date]
                 ,y=my_data[my_data['prediction']==1][prediction_status],
            mode='lines',
            line={'dash':'dot', 'width':1},
            marker={'color':colors[prediction_status]},
            name="{} Predicted".format(prediction_status),
            legendgroup=prediction_status,
            stackgroup='stack-pred',
            showlegend=False
                ))

    fig.update_layout(
        legend=dict(
            bordercolor="Gray",
            borderwidth=1.5,
            yanchor="top",
            y=0.99,
            xanchor="right",
            tracegroupgap = 0
        ),
        legend_title_text=level.replace('_',' ').title() if level is not None else None,
        yaxis={'rangemode':'tozero'}
    )
When I do not include a stackgroup argument in my add_trace functions, the start dates for each. series populates as expected.
I think there is probably a layout argument I am not familiar with that can resolve this. But if someone could help me fix this, so each trace in an area chart appears to begin when it’s data begins (and not at the y-axis), I’d greatly appreciate it.