Hello,
I am new to plotly.js and what I would like to do is a gauge graph with animation on the needle when the value is updated. I checked the animation API method, but when animating a gauge with shapes, nothing is animating so I wondering if it’s possible to use animation with this type of graphs or not?
Why as a scatter? Would not this change the whole gauge look?
I will try it when have some time.
For now what I did is this: creating a needle as a shape, than instead calculating the position of the needle at every update, I placed it at 0 degrees, and than with CSS rotation and transitions was able rotate it at the desired degree, maybe sounds a bit hacky but works well and was a simple solution.
Another thing that I noticed was that if the needle is calculated with this formula
function gaugePointer(value){
var degrees = 180 - value,
 radius = .5;
var radians = degrees * Math.PI / 180;
var x = radius * Math.cos(radians);
var y = radius * Math.sin(radians);
// Path: may have to change to create a better triangle
var mainPath = 'M -.0 -0.035 L .0 0.035 L ',
pathX = String(x),
space = ’ ‘,
pathY = String(y),
pathEnd = ’ Z’;
var path = mainPath.concat(pathX,space,pathY,pathEnd);
return path;
}
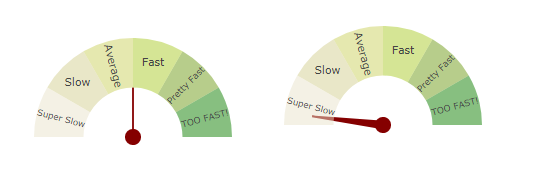
the shape of the needle was different
at 90° and 10° the shape changes, tried to figure it out why, but after setting the needle at 0 and than animating with CSS the needle shape was always the same, so with CSS solved 2 problems.