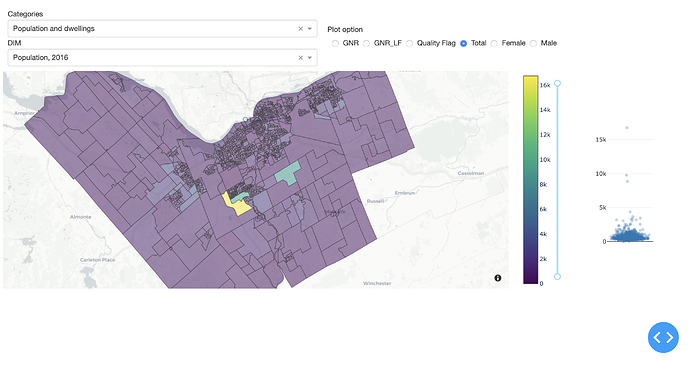
I have made a dashboard that looks like the following (the code will be at the end). Now I have two problems with it.
- I cannot get the map to fill all the empty area under it.
- I cannot get the scatter plot on the right to fill its span and match the edge of the map plot. (I’m using it as a way to show the distribution of the points so the user can set the range slider for better visualization so bonus point if you can lead me to a better way.
I’ve watched a few videos and looked up tutorials that use bootstrap but if I have understood it well it’s just setting the width and height in the style. Now it can be manual or predefined.
app.layout = html.Div([
    html.Div([
        html.Div([...], style={'width': '45%', 'height': '20%', 'display': 'inline-block', 'padding': 10}),
        html.Div([...], style={'width': '45%', 'height': '20%', 'display': 'inline-block', 'padding': 10}),
        html.Div([
            html.Div([dcc.Graph(id='the_map')], style={'width': '80%', 'display': 'inline-block', 'margin': zm}),
            html.Div([dcc.RangeSlider(id='range_sl', allowCross=False, vertical=True)], style={'width': '2%', 'display':'inline-block', 'margin': zm}),
            html.Div([dcc.Graph(id='scatter', config={'displayModeBar':False})], style={'width': '18%', 'display': 'inline-block', 'margin':zm} ),
            html.Div(id='cs_sel_div', style={'display':'none'})
        ], style={'height': '80%'})
    ]),
])
My understanding is that the first two Divs should take 20% of the top of the screen (each half).
The bottom 80% should be the three elements I have and they should inherit the height from their parent to fill the whole 80%. But, it seems I’m wrong so heeellpppp
