Hi here,
I have the following country lat and lon info that I use to display a fig.scatter_geo()
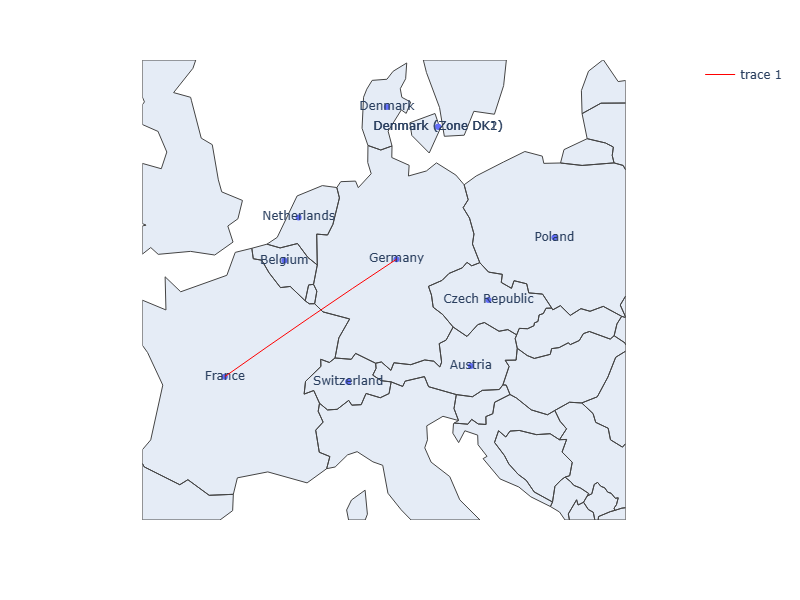
I would like to add afew arrows between countries. However I get a ValueError received for the ‘axref’ property of layout.annotation Received value: ‘lon’.
If I change the axref, ayref, xref, yref to ‘x’, ‘y’ The arrow appears but on a XY coordinate and not on the lon, lat geo map coordinates.
Below a very simple example of what I am trying to do.
Many thanks
data = {
    'Country Code': ['at', 'be', 'ch', 'cz', 'de', 'dk', 'dk1', 'dk2', 'fr', 'nl', 'no2', 'pl', 'se', 'se4'],
    'Country Name': ['Austria', 'Belgium', 'Switzerland', 'Czech Republic', 'Germany', 'Denmark', 'Denmark (Zone DK1)', 'Denmark (Zone DK2)', 'France', 'Netherlands', 'Norway (Zone NO2)', 'Poland', 'Sweden', 'Sweden (Zone SE4)'],
    'Latitude': [47.5162, 50.8503, 46.8182, 49.8175, 51.1657, 56.2639, 55.6761, 55.6761, 46.6034, 52.3676, 60.4720, 51.9194, 60.1282, 58.1282],
    'Longitude': [14.5501, 4.3517, 8.2275, 15.4730, 10.4515, 9.5018, 12.5683, 12.5683, 1.8883, 4.9041, 5.4689, 19.1451, 18.6435, 14.6435]
}
cc = pd.DataFrame(data)
fig = px.scatter_geo(cc,
                     lat='Latitude',
                     lon='Longitude',
                     text='Country Name',
                     hover_name='Country Name',
                     hover_data=['Country Code'],
                     geojson='geometry',
                     scope='europe')

# Adding a manual Line between FR -> DE   FR_X_lon, FR_Y_lat   DE_X_lon DE_Y_lat
fig.add_annotation({'ax': 1.8883, 'ay': 46.6034, 'axref': 'lon', 'ayref': 'lat', 'x': 10.4515, 'y':51.1657, 'xref': 'lon', 'yref': 'lat', 'showarrow': True, 'arrowhead': 1})